
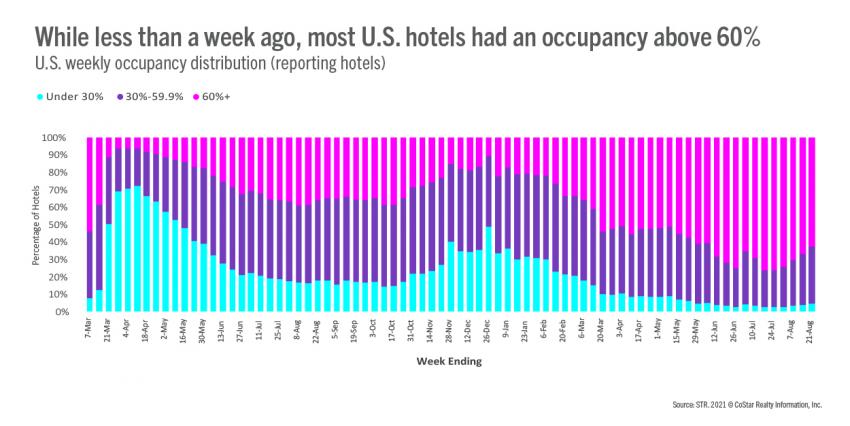
With surging COVID-19 infection rates and most schools now back in session, it’s not surprising that U.S. hotel occupancy continued to dip in the latest week of reporting (15-21 August 2021). Occupancy, down to 63.7% in the most recent seven-day period, has fallen by two percentage points or more in each of the past three weeks. On a total-room-inventory basis (TRI), which accounts for temporarily closed hotels, weekly occupancy was 61.3%.
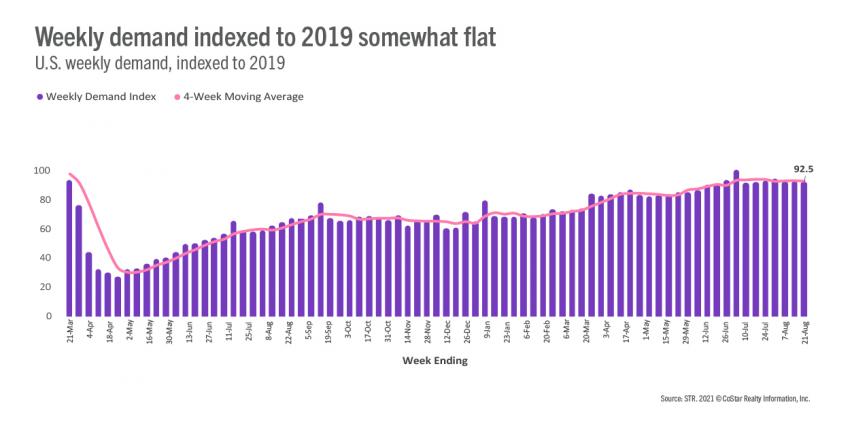
While increased COVID-19 cases are likely affecting demand, most of the loss appears to be seasonal due to the return of in-person schools. Looking back at 2019, from mid-July to mid-August, the U.S. saw demand fall by 2.8 million rooms as schools went back into session. In the same five weeks of 2021, demand fell by 2.9 million room or 125,000 more than 2019. Overall, weekly demand indexed to 2019 was at 92.5, meaning the industry sold slightly more than 92% of the volume of 2019. As compared with five weeks ago, the demand index to 2019 is down 1.1 points.
Florida saw the largest decrease in demand this past week with 42 other states also seeing weekly declines. As compared with 2019, 18 states had demand that was higher than what it was during the corresponding week of 2019. The number of states above 2019 demand levels has been in the mid-to-high teens for the past seven weeks. Another 22 states reported demand that was 90% of 2019 levels, and the percentage of states at that level has also produced little change over the past seven weeks.
Demand was also lower across 71% of 166 STR-defined markets. The worst dip was in Orlando, which lost 84,000 room nights in the week with an index to 2019 falling to 66—the market’s lowest of the past 14 weeks. However, 75 markets continued to report demand that was higher than what it was in the comparable week of 2019, more than in the previous two weeks, and 77% of all markets saw 90% or more of their 2019 demand in the week. The percentage of markets observing that level of demand has changed minimally in the past seven weeks. In total, the U.S. sold 24.5 million rooms in the week or an average 3.5 million per day, down from 3.6 million per day in the previous week. At its summer peak five weeks ago, the industry sold an average of 3.9 million rooms per day.
Average daily rate (ADR) also went lower for a third straight week, decreasing 2.6%, which was the largest week-to-week decline thus far. The largest declines were seen during the weekend outside of the Top 25 Markets. Indexed to 2019, nominal ADR has been above its 2019 level for eight weeks with real ADR (ADR adjusted for inflation) at the 2019 level in six of the past eight weeks. There were 135 markets with weekly nominal ADR higher than what it was in 2019, the most since the beginning of July. Among the Top 25 Markets, 12 reported higher nominal ADR than in 2019 despite most seeing lower demand and occupancy.
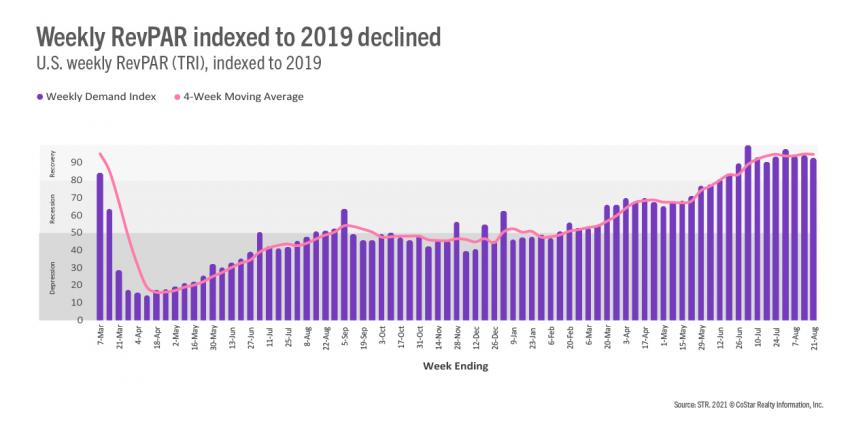
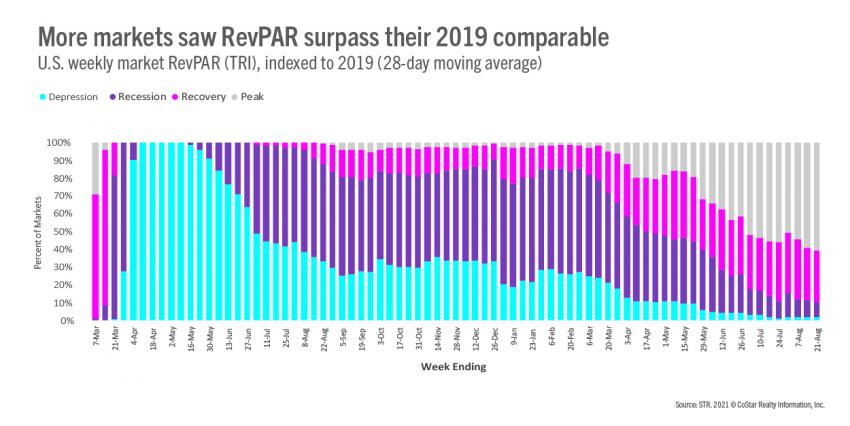
TRI RevPAR fell again, the fourth straight weekly decline, and by the largest percentage so far (-5.7%). Indexed to 2019, TRI RevPAR declined 1.5 points to 93. On an inflation-adjusted basis, the index was 88. In all, 126 markets (75%) reported a drop in weekly TRI RevPAR with slightly more than half seeing a decrease in their index to 2019. At the same time, 100 markets reported a TRI RevPAR higher than what it was in 2019, down from 101 markets in each of the previous two weeks. On a 28-day moving average, 101 markets had TRI RevPAR higher than what it was in 2019 (Peak), a pandemic-era high. Another 48 were in “Recovery” as TRI RevPAR indexed to 2019 was between 80 and 100. Only 17 markets were in “Recession” (TRI RevPAR indexed to 2019 between 50 and 80) or “Depression” (TRI RevPAR indexed to 2019 under 50).
Outside the U.S.
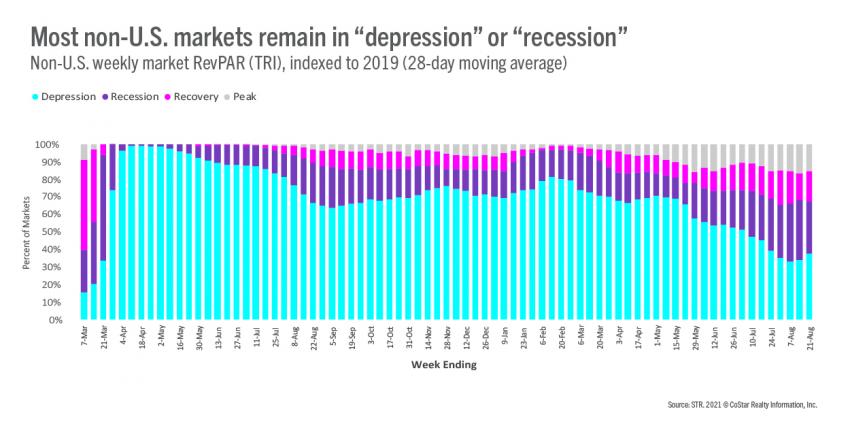
Occupancy outside the U.S. (104 countries) decreased for a fourth week to 38.7%. Most notably, China remained depressed with occupancy at 30%, nearly unchanged from the previous week. Occupancy in the United Kingdom also was unchanged at 66%. Canada, however, continued to see growth with the border now open to vaccinated Americans, up two percentage points to 62%. On a market basis, 38% of non-U.S. markets remain depressed as TRI RevPAR was less than 50% of what it was in 2019. Thirty percent of non-U.S. markets were in “Recession.” The remainder were nearly evenly divided in the “Recovery” and “Peak” categories.
Big picture
Currently, it is difficult to discern and quantify the impact of the Delta variant on performance given the seasonal slowdown in leisure travel that was already underway. We believe that COVID’s true impact will be felt in the coming weeks as it will hamper the nascent business/group travel we had expected to return in the fall as offices reopened. With many businesses mindful of their duty of care, we now anticipate added reluctance for increased non-essential business travel in the near term.
To learn more about the data behind this article and what STR has to offer, visit https://str.com/.


Sign up to receive our stories in your inbox.
Data is changing the speed of business. Investors, Corporations, and Governments are buying new, differentiated data to gain visibility make better decisions. Don't fall behind. Let us help.


Sign up to receive our stories in your inbox.
Data is changing the speed of business. Investors, Corporations, and Governments are buying new, differentiated data to gain visibility make better decisions. Don't fall behind. Let us help.