
Through July 2021 with Forecasts from July 2022
Introduction
The CoreLogic Home Price Insights report features an interactive view of our Home Price Index product with analysis through July 2021 with forecasts from July 2022.
CoreLogic HPI™ is designed to provide an early indication of home price trends. The indexes are fully revised with each release and employ techniques to signal turning points sooner. CoreLogic HPI Forecasts™ (with a 30-year forecast horizon), project CoreLogic HPI levels for two tiers—Single-Family Combined (both Attached and Detached) and Single-Family Combined excluding distressed sales.
The report is published monthly with coverage at the national, state and Core Based Statistical Area (CBSA)/Metro level and includes home price indices (including distressed sale); home price forecast and market condition indicators. The data incorporates more than 40 years of repeat-sales transactions for analyzing home price trends.
HPI National Change
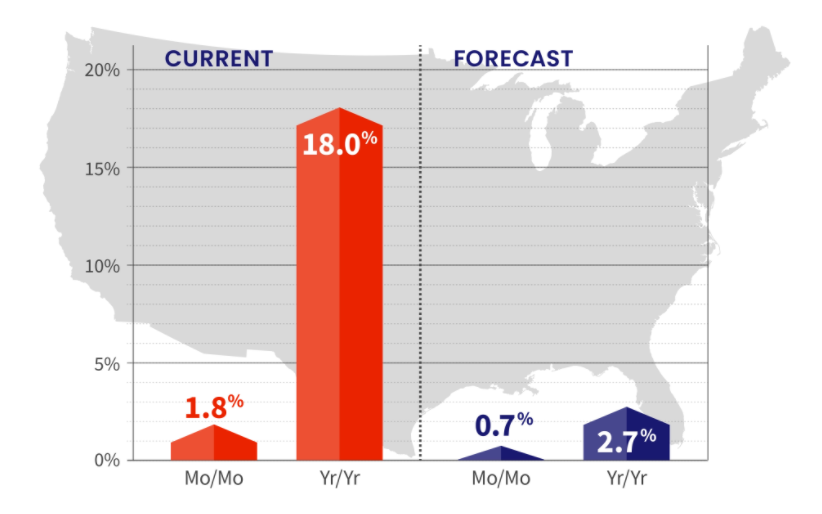
July 2021 National Home Prices
Home prices nationwide, including distressed sales, increased year over year by 18% in July 2021 compared with July 2020 and increased month over month by 1.8% in July 2021 compared with June 2021 (revisions with public records data are standard, and to ensure accuracy, CoreLogic incorporates the newly released public data to provide updated results).
Forecast Prices Nationally
The CoreLogic HPI Forecast indicates that home prices will increase on a month-over-month basis by 0.7% from July 2021 to August 2021, and on a year-over-year basis by 2.7% from July 2021 to July 2022.
“Home price appreciation continues to escalate as millennials entering their prime home buying years, renters looking to escape skyrocketing rents and deep pocketed investors drive demand. On the supply side, it is also the result of chronic under building, especially of affordable stock. This lack of supply is unlikely to be resolved over the next 5 to 10 years without more aggressive incentives for builders to add new units.”
-Frank Martell
President and CEO of CoreLogic
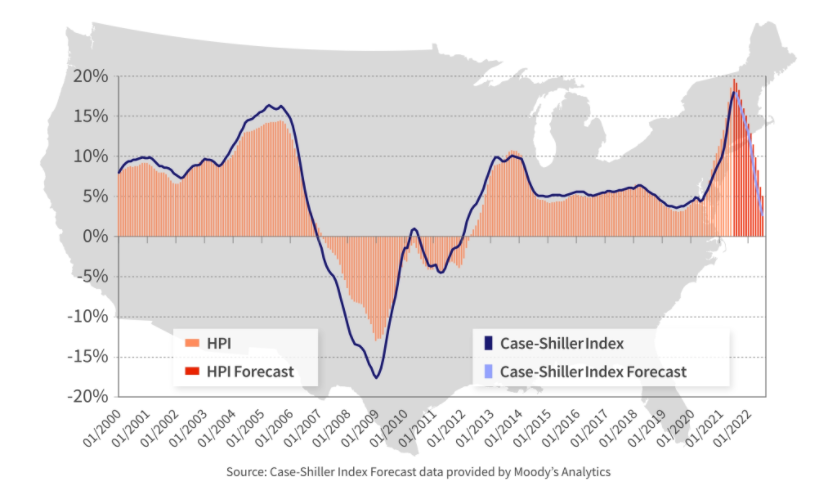
HPI & Case-Shiller Trends
This graph shows a comparison of the national year-over-year percent change for the CoreLogic HPI and CoreLogic Case-Shiller Index from 2000 to present month with forecasts one year into the future. We note that both the CoreLogic HPI Single Family Combined tier and the CoreLogic Case-Shiller Index are posting positive, but moderating year-over-year percent changes, and forecasting gains for the next year.
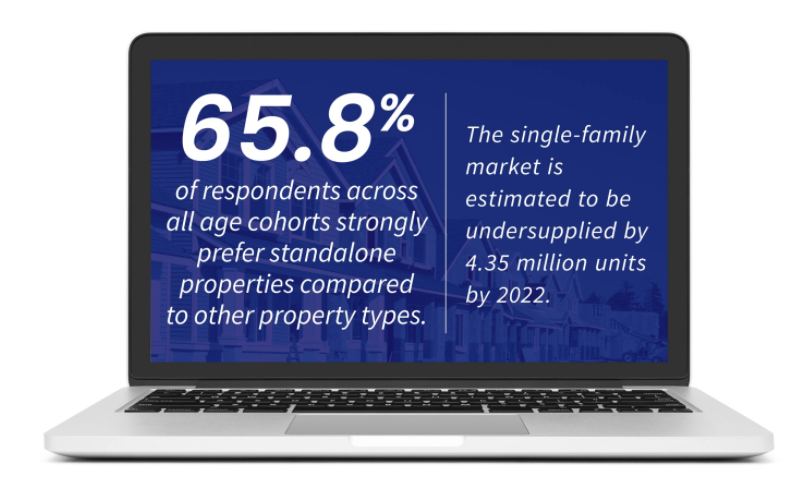
COVID-19 Impact on Home Prices
With mortgage rates remaining near record lows, the ongoing challenges of persistent demand and constricted supply continue to put upward pressure on home prices. A recent CoreLogic survey of consumers looking to buy homes shows that, on average, 65.8% of respondents across all age cohorts strongly prefer standalone properties compared to other property types. Given the widespread demand, and considering the number of standalone homes built during the past decade, the single-family market is estimated to be undersupplied by 4.35 million units by 2022.
“July’s annual home price growth was the most that we have ever seen in the 45-year history of the CoreLogic Home Price Index. This price gain has far exceeded income growth and eroded affordability. In the coming months this will temper demand and lead to a slowing in price growth.”
– Dr. Frank Nothaft
Chief Economist for CoreLogic
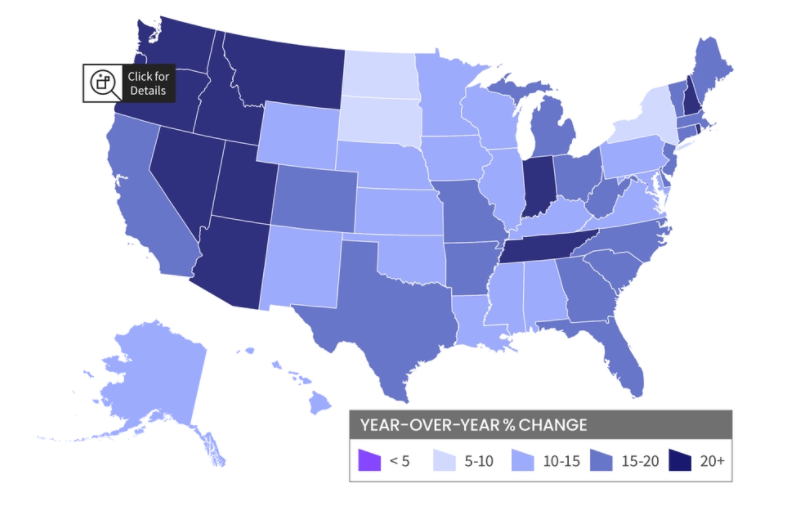
HPI National and State Maps – July 2021
The CoreLogic HPI provides measures for multiple market segments, referred to as tiers, based on property type, price, time between sales, loan type (conforming vs. non-conforming) and distressed sales. Broad national coverage is available from the national level down to ZIP Code, including non-disclosure states.
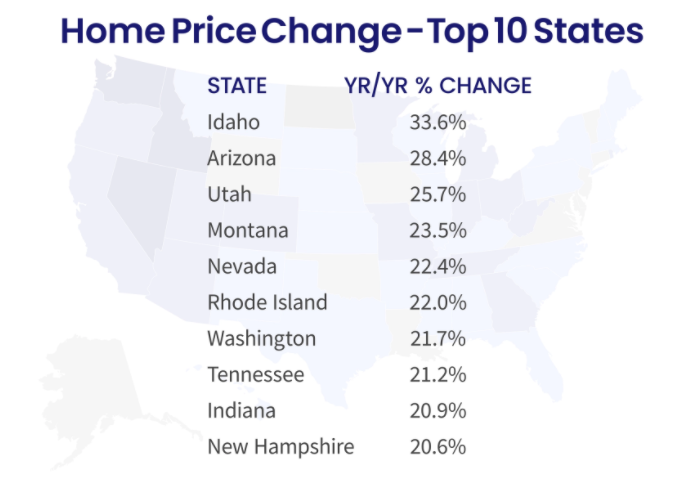
Nationally, home prices increased 18% year over year in July. No states posted an annual decline in home prices. The states with the highest increases year-over-year were Idaho (33.6%), Arizona (28.4%), and Utah (25.7%).
HPI Top 10 Metros Change
The CoreLogic HPI provides measures for multiple market segments, referred to as tiers, based on property type, price, time between sales, loan type (conforming vs. non-conforming) and distressed sales. Broad national coverage is available from the national level down to ZIP Code, including non-disclosure states.
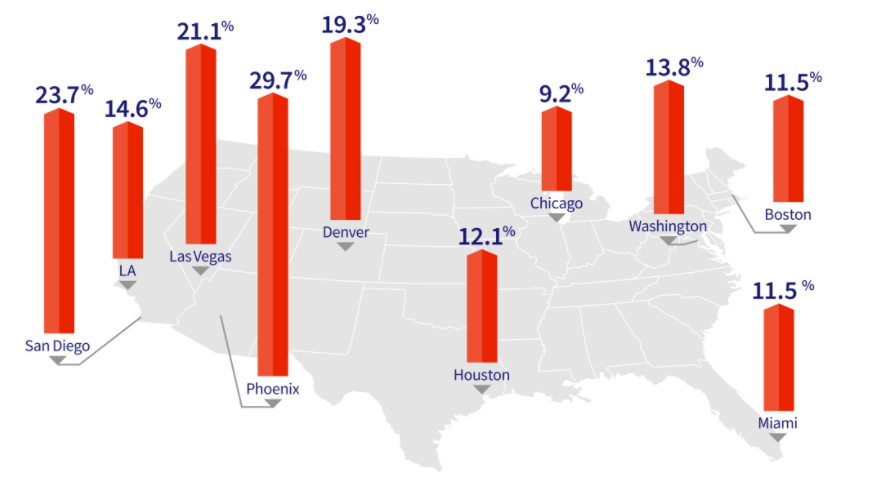
These large cities continue to experience price increases in July, with Phoenix leading the way at 29.7% year over year.
Markets to Watch: Top Markets at Risk of Home Price Decline
While home price changes on the local level vary, July gains across all of the top 10 metros surpassed their 2020 levels. However, metro areas where affordability constraints are prevalent continue to persist as prices rise. For instance, in July, home prices in San Diego increased 23.7% year over year and are forecasted to increase an additional 9.1% over the next 12 months.
Conversely, The HPI Forecast also reveals the continued disparity in home price growth across metros. In markets like Houston, which was hit hard by the collapse of the oil industry and the recent hurricane season, home prices are expected to decline 1.1% by July 2022.
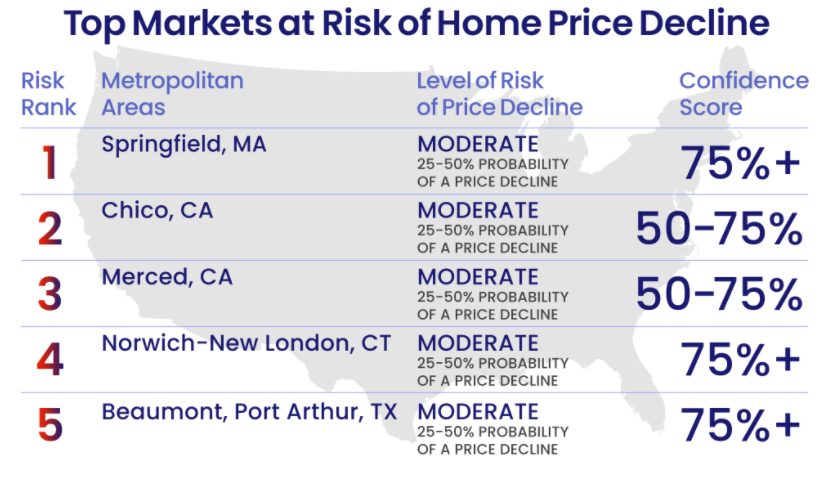
The CoreLogic Market Risk Indicator (MRI), a monthly update of the overall health of housing markets across the country, predicts that metros such Springfield, Massachusetts; Chico, California; Merced, California; Norwich-New London, Connecticut; and Beaumont-Port Arthur, Texas are at the greatest risk (25-50%) of a decline in home prices over the next 12 months.
To learn more about the data behind this article and what CoreLogic has to offer, visit https://www.corelogic.com/.


Sign up to receive our stories in your inbox.
Data is changing the speed of business. Investors, Corporations, and Governments are buying new, differentiated data to gain visibility make better decisions. Don't fall behind. Let us help.


Sign up to receive our stories in your inbox.
Data is changing the speed of business. Investors, Corporations, and Governments are buying new, differentiated data to gain visibility make better decisions. Don't fall behind. Let us help.