
Our latest whitepaper analyzes the tourism and travel recovery following a year and a half of extraordinary challenges. We dove into foot traffic data for cities, states, hotels, airports, and tourist attractions across the countries to understand how the pandemic impacted – and continues to impact – these critical industries.
Domestic Tourism Rises Across All States
For this whitepaper, we supplemented our usual data streams with data from Placer.ai’s free COVID Recovery Dashboard, which measures retail and domestic tourism visits across every state, county, city, and zip code in the United States. The data shows that despite rising COVID concerns, domestic tourism visits (visits by individuals living more than 50 miles away from the visited area) increased across all states in July when compared to July 2019, and the visit growth remained positive throughout August.
Zooming into the August visit data for some of the most visited states unveils a year-over-two-year visit growth of 22.4% for New York; 18.0% for California; 51.0% for Florida; 29.5% for Texas; 30.5% for Nevada; and 14.4% visit growth for Illinois when compared to August 2019.
It is likely that the difficulty and uncertainty surrounding international travel contributed to the swell in domestic tourism. As COVID (hopefully) recedes in the upcoming months and international destinations are once again easily accessible, tracking tourism trends will reveal whether the pandemic boost to domestic travel is another COVID anomaly or a permanent feature of the new normal.
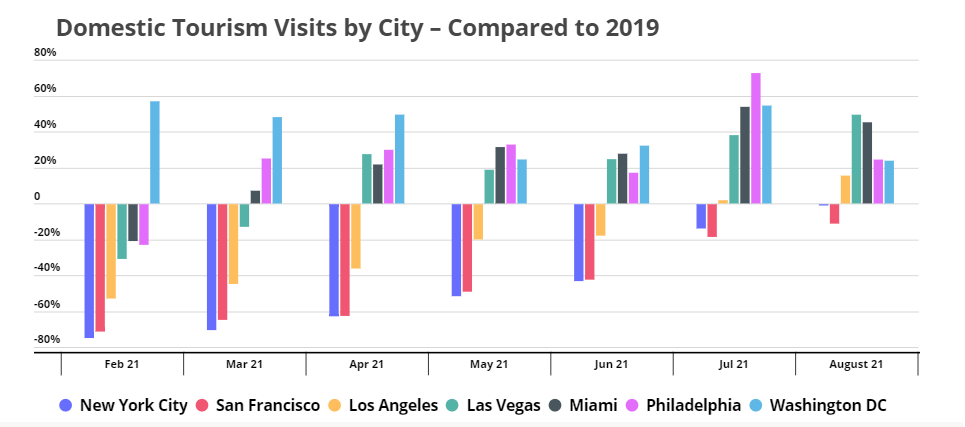
Uneven Domestic Tourism Recovery for Major US Cities
While all the states experienced a summer visit bump, not all cities were as lucky. Monthly visits to Los Angeles, Las Vegas, Miami, Philadelphia, and Washington, D.C. rose in August compared to 2019 – 15.8%, 49.5%, 45.2%, 24.3%, and 24.1%, respectively – but visits to New York City barely reached 2019 levels while visits to San Francisco also lagged behind.
One reason for the discrepancy between the cities could be the slow return of business travel. Los Angeles, Las Vegas, Miami, Philadelphia, and Washington D.C. all offer numerous recreational activities and/or historical sites that appeal to families and individuals looking to book leisure trips for a change of scenery after this difficult year and a half. San Francisco, on the other hand, relies much more heavily on business and convention tourism, and so the city may not see a full visit recovery until in-person meetings and conferences return. New York City, as a popular business and leisure destination, also struggled initially, but seems to have now found its footing.
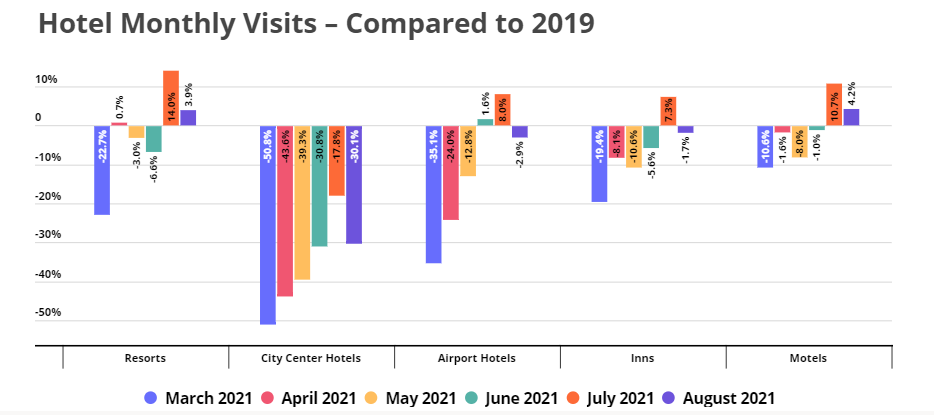
Where Are All the Tourists Staying?
Diving into the hospitality recovery sheds some additional light on the tourism recovery. While visits to resorts, airports, inns, and motels have more or less recovered, visits to city center hotels remain far below their 2019 levels. Perhaps travelers who want to enjoy their vacation while minimizing the risk of infection are avoiding more crowded urban areas and opting for hotels with easier access to outdoor activities.
The hospitality foot traffic data also exposes an August drop in visits. Some hotel categories that had achieved year-over-two-year visit growth in July fell back below their 2019 monthly baseline in August, and other categories saw their visit gap balloon. With the July and August rise in COVID cases, tourists might be choosing more insulated accommodation options – such as Airbnb – over accommodations that would bring them in contact with a multitude of strangers.
How will the increased ease of international travel affect domestic tourism? Will the return of business travel help city center hotels?
To learn more about the data behind this article and what Placer has to offer, visit https://www.placer.ai/.


Sign up to receive our stories in your inbox.
Data is changing the speed of business. Investors, Corporations, and Governments are buying new, differentiated data to gain visibility make better decisions. Don't fall behind. Let us help.


Sign up to receive our stories in your inbox.
Data is changing the speed of business. Investors, Corporations, and Governments are buying new, differentiated data to gain visibility make better decisions. Don't fall behind. Let us help.