
Week ending 18 September
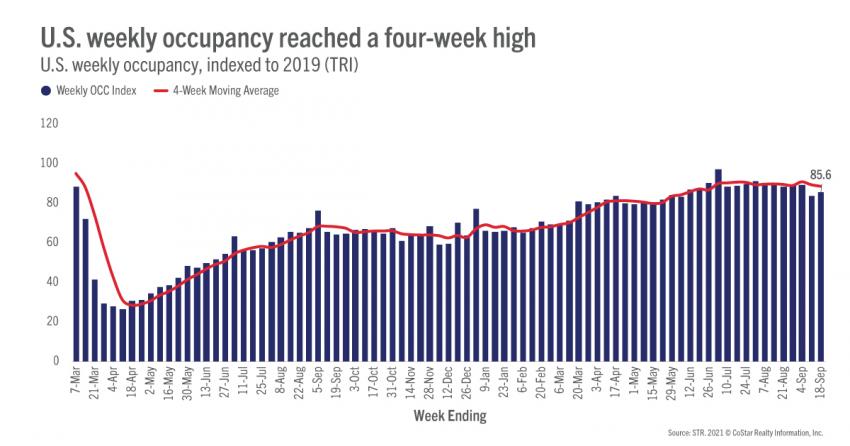
In an unexpected turn, U.S. demand and occupancy advanced in the latest week of reporting (12-18 September 2021) to the best levels of the past four weeks. Weekly demand increased 1.2 million rooms to 24.3 million, which was the largest weekly gain of the past nine weeks, pushing occupancy to 63.0%. Subdued demand was expected this week due to the mid-week observance of Yom Kippur.
Daily occupancy advanced every day of the week, except Sunday, growing week on week and day on day, culminating in a level of 78% on Saturday. That level was the second highest of the past seven weeks and was only surpassed by Saturday ahead of Labor Day. On a total-room-inventory basis (TRI), which accounts for temporarily closed hotels, weekly occupancy was 60.6%. A little more than 49,000 rooms remain temporarily closed, mostly in New York City, which accounts for 28% of the temporarily closed rooms, and Orlando (12%).
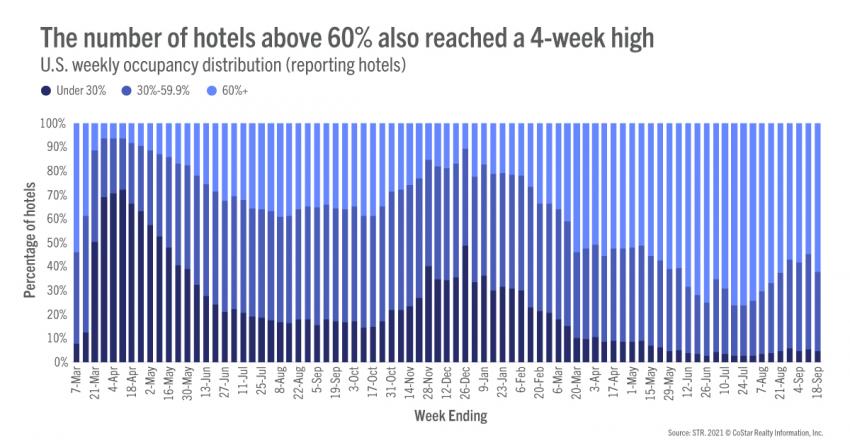
Digging into demand further, 62% of all reporting hotels saw weekly occupancy surpass 60% with most above 70% and a quarter above 80%. Like with other demand and occupancy metrics, the percentage of hotels at the upper end of the occupancy scale reached four-week highs. Weekday occupancy also rose to a four-week high (58%) as occupancy in the Top 25 Markets advanced to 56%, three percentage points lower than hotels in other markets. More encouraging, 60% of hotels in the Top 25 saw occupancy surpass 60%, the most in four weeks. The largest demand gains in the Top 25 were seen by Upscale and Upper Upscale hotels, which accounted for nearly 60% of the weekly growth. Looking at performance by Top 25 hotels clustered on various attributes, group hotels saw weekday occupancy advance by nearly two percentage points for a second straight week with this week’s occupancy settling at 48%, their highest level since mid-August. Overall, Top 25 weekday group demand increased by more than 200,000 room nights, the biggest gain in nine weeks, which suggests nascent conference travel. Weekend demand and occupancy continued to impress with occupancy up to 73% in the Top 25 and 76% elsewhere. In non-top 25 Markets, weekend occupancy was nearly equal to the level seen during the Labor Day weekend.
More than 84% of all markets saw demand growth in the week. As compared with the same week in 2019, which was free of any holidays and religious observances, 73% of markets reported demand that was 90% or more the level seen in that year. Even against somewhat more difficult comparisons, the weekly 2019 demand index rose 2.2 points, the best weekly gain in 11 weeks. Over the past 11 weeks, the weekend 2019 demand index has ranged from 92 (the weekend before Labor Day) to 101 (Labor Day weekend). This past weekend it was 99.
Weekly ADR was essentially flat from the previous week (+0.1%) with the 2019 index dropping by 1.3 points to 97. That was the second straight week below 100, meaning this week’s rates were 3% lower than what they were in 2019. Adjusting for inflation, weekly ADR was eight percent lower than the comparable 2019 week. A further look revealed weekday ADR fell 1.9% week over week, but weekend ADR rose 3%. Weekday Luxury chain scale ADR fell 0.8% while weekday Upper Upscale ADR increased 0.6%. The biggest weekday ADR losers were midscale and economy, each down 3%. Overall, as compared with three weeks ago, industry ADR is down 1% driven by weekday declines (-2.6%), especially in leisure destinations that saw strong summer gains. However, Top 25 Markets have seen weekday ADR increase 3.2% from three weeks ago. New York City weekday ADR was up 25% as compared with the week ending 28 August 2021.
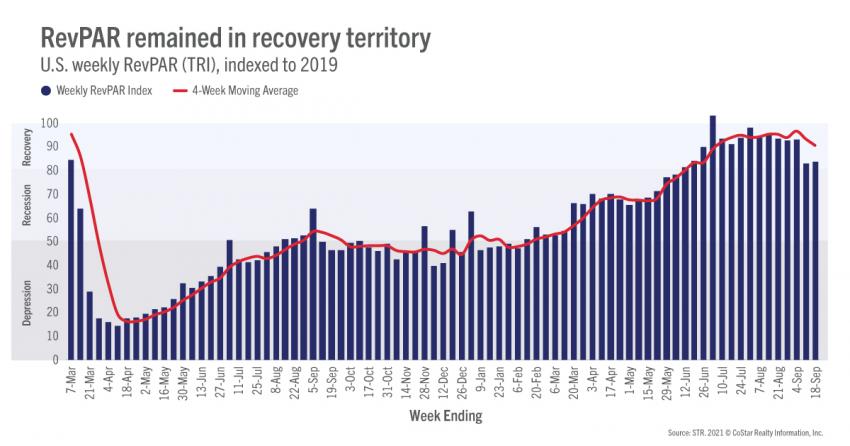
The industry remained in STR’s “recovery” zone as weekly TRI RevPAR indexed to 2019 increased 0.8 points to 84. The industry has been in recovery for the past 15 weeks as the TRI 2019 RevPAR index has been above 80. For the week, 134 markets (81% of all STR markets) were either in “recovery” or at “peak” (TRI RevPAR indexed to 2019 above 100). Five markets, two more than last week, were in the “depression” category (TRI RevPAR indexed to 2019 under 50). San Francisco continued to see the lowest 2019 TRI RevPAR index as it has for nearly the entire year. On a 28-day moving total basis, 89% of markets were in “recovery” or “peak,” down from 90% last week. The percentage remains high on that basis given the strong summer gains observed in many destination markets.

Outside the U.S.
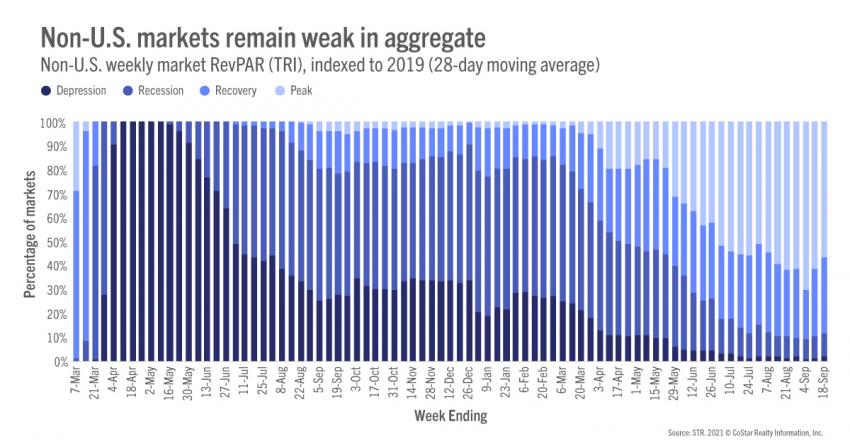
Occupancy outside the U.S. inched up to 42.1%, up 0.4 percentage points week over week to an index of 56. Among the 10 largest countries, based on hotel supply, the U.K. had the highest occupancy at 68%, up a percentage point from the previous week. Canada also saw solid growth, up three percentage points to 55%. Occupancy in China was nearly flat at 45%. On a market basis, weakness prevailed as the percentage of hotels in “recovery” or “peak” fell from 33% in the previous week to 30% this week. A third of all global markets remained in “depression.”
Big Picture
This week’s results were a pleasant surprise. While we know that difficult days remain, it was encouraging to see weekday results, particularly in the Top 25 and among Upper Upscale hotels, tick up a bit. TSA screenings have also not worsened as much as we expected, remaining above 70% of 2019’s level in the past week with throughput gains observed in the current week. Weekends remain strong. Thus, we are inclined to believe that performance in the fall will be slightly better than what we all expected, even with the surge of the Delta variant.
To learn more about the data behind this article and what STR has to offer, visit https://str.com/.


Sign up to receive our stories in your inbox.
Data is changing the speed of business. Investors, Corporations, and Governments are buying new, differentiated data to gain visibility make better decisions. Don't fall behind. Let us help.


Sign up to receive our stories in your inbox.
Data is changing the speed of business. Investors, Corporations, and Governments are buying new, differentiated data to gain visibility make better decisions. Don't fall behind. Let us help.