Week ending 25 September
U.S. demand and occupancy continued to surprise and delight as both measures rose again during 19-25 September 2021, which was the second consecutive week of such gains. Most industry observers expected a moderate to sharp performance decrease in the weeks after Labor Day given the seasonal return to in-person schooling as well as the increase in COVID hospitalizations and a low volume of business travel.
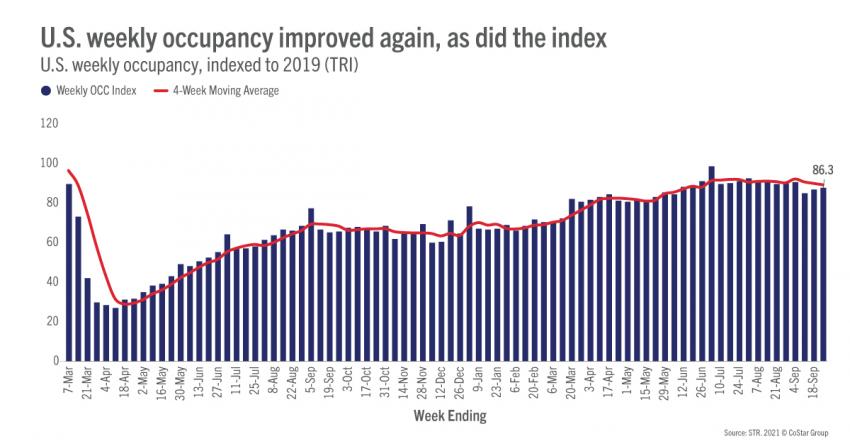
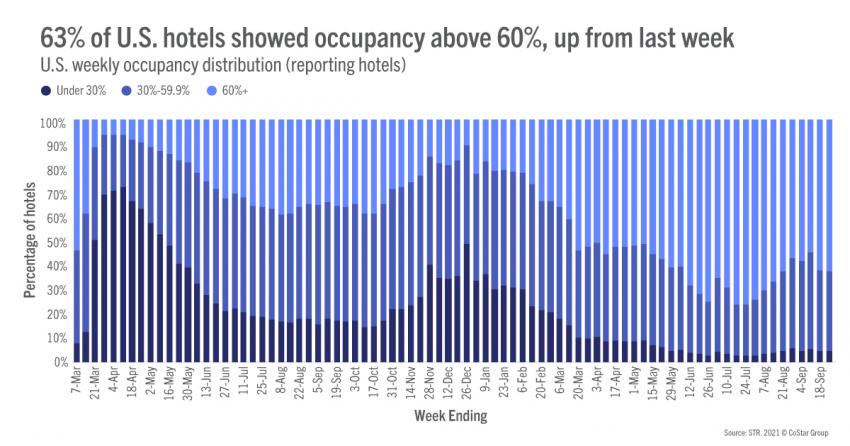
Occupancy for the week advanced to 63.2%, up 0.3 points week on week and 89% of the comparable level from 2019. During the summer, from the week of Memorial Day to the week of Labor Day, occupancy averaged 66.1% and 91% of 2019’s levels. For this last week, occupancy growth was led by weekend demand gains, which accounted for 81% of the week’s total demand growth. Weekday occupancy also rose but only slightly. More than 63% of all reporting hotels saw weekly occupancy above 60% during the week, which was a bit more than in the previous week. On a total-room-inventory basis (TRI), which accounts for temporarily closed hotels, weekly occupancy was 60.9%. A little more than 50,000 rooms remain temporarily closed, also up slightly from the previous week.
Another pleasant surprise was the 1.9% upturn in average daily rate (ADR), the largest gain of the past nine weeks. Even with the higher growth, a 2% ADR deficit remained when compared with 2019. Recall, during the summer, ADR had been higher than 2019 comparables for several weeks. Adjusting for inflation, last week’s ADR was 8% lower than in 2019. The week-to-week increase came mainly from weekdays, which accounted for a slight majority of the gain. A week ago, the weekend was mostly responsible for growth in revenue and ADR.
Top 25 Market occupancy increased for a second consecutive week, rising to 62%, up 1.4 points week on week. The increase in the Top 25 was driven by weekdays, which accounted for 59% of the weekly demand gain. Weekday demand growth was spread across all days with the largest increases seen on Wednesday and Thursday. Orlando and New York accounted for two thirds of the weekday demand rise posted by the Top 25. Boston, Washington, DC., Phoenix were among the weekday gainers, whereas Chicago, Detroit, and Atlanta were the weekday demand losers. Thirteen Top 25 Markets saw weekday demand that was at least 80% of what it was in the comparable week of 2019, and 51% of Top 25 hotels showed weekday occupancy that was 60% or more, which was one percent more than in the previous week.
Like the rest of the industry, Top 25 weekly ADR showed solid growth, up 4.5%, week on week. All but eight of the Top 25 Markets saw weekly growth, led by Boston (16%) and New York City (11%). ADR in 19 of the major markets was 90% or more of 2019 levels with 10 markets reporting ADR higher than what it was two years ago. Miami’s ADR was 19% higher this past week versus the same week in 2019. Top 25 weekday ADR rose a bit more (4.8%) and was led by New York City (17%) and Washington, DC (11%).
Group hotels in the Top 25 also saw an improvement as 37% reported weekday occupancy above 60% this week as compared with 33% a week ago. Speaking of groups, group demand (Luxury and Upper Upscale classes) grew 5.7% week over week, which was the sixth consecutive weekly gain and the highest weekly demand of the past 81 weeks. Group ADR skyrocketed as well, increasing almost US$16 from the previous week to US$214. This was the first week that group ADR exceeded US$200 since the start of the pandemic and the highest group ADR since February 2020.
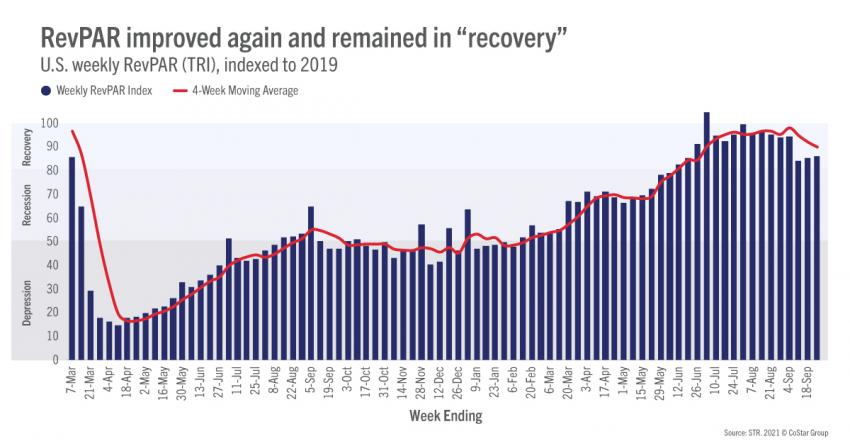
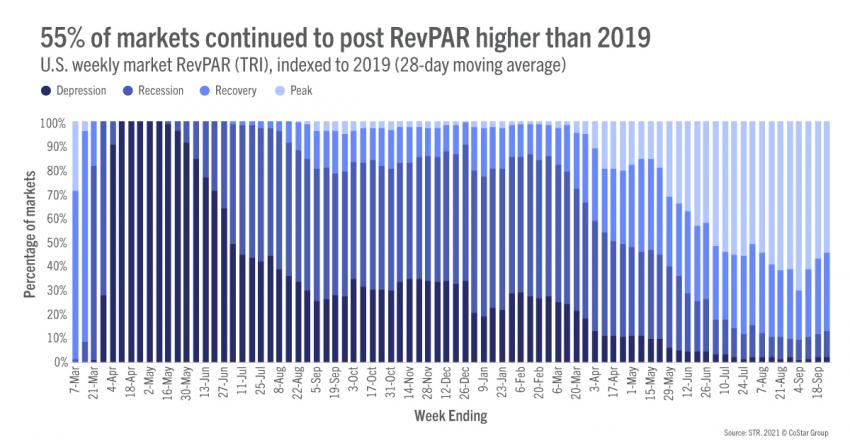
For a 16th straight week, TRI RevPAR remained in STR’s “recovery” category, climbing another point to 84.8. Recall, the categories are based on weekly market TRI RevPAR indexed to the same week in 2019. “Recovery” is defined as an index above 80 but below 100. “Peak” is when the index is above 100, meaning TRI RevPAR is higher than what it was in 2019. Last week, the percentage of markets at “peak” increased to 51% from 49% the week prior. Another 33% of markets were in “recovery,” unchanged from the previous week. Three markets (San Francisco, San Jose, and New York City) were in STR’s “depression” category (TRI RevPAR below 50). The TRI RevPAR index on a 28-day moving total basis fell to 88.6. The index spent much of the summer in the 90s. Note, the last three weeks involved difficult comparisons to 2019, which was particularly strong due to the shift in the Labor Day holiday and the Jewish observances. The next two weeks should see stronger indices as the 2019 Jewish observances were in late September and early October.
Outside the U.S.
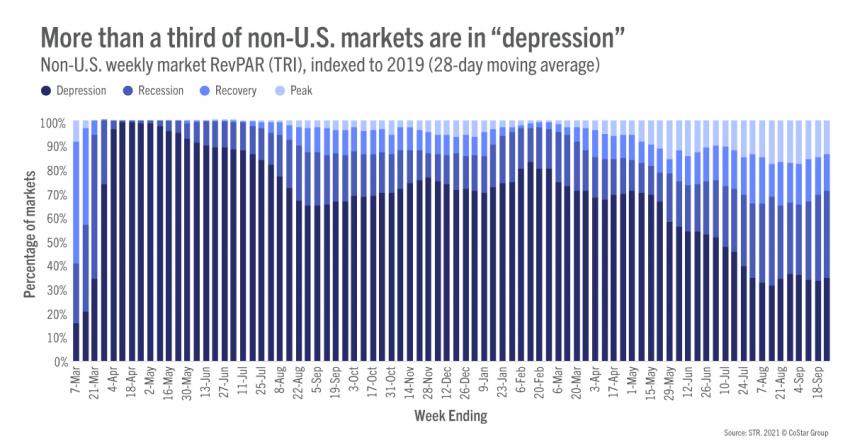
Weekly occupancy outside the U.S. fell slightly from 43% to 42%. Demand remained above 97 million as it has for the past five weeks. ADR also advanced, up 4% after falling for the previous five weeks. The U.K. saw the highest occupancy (67%) of the top 10 largest countries based on supply, but it was down by more than a point versus the previous week. Occupancy in Canada dropped sharply (4 percentage points) to 51%. After climbing in the previous week, China’s occupancy also fell by 4 percentage points to 42%, its lowest occupancy of the past three weeks. Weekly non-U.S. market TRI RevPAR stayed into the “recession” category (TRI RevPAR indexed to 2019 between 50 and 80). Seventy percent of non-U.S. markets were either in “depression” or “recession,” the highest percentage of the past 10 weeks.
Big Picture
While we are certain that the weeks ahead will see plenty of optimism, we also know that concern about the future remains on the forefront. However, based on the data, particularly in top 25 Markets and in the group segment, we believe the industry is truly on the road to recovery. While two weeks of gains is still shaky and fragile evidence, we should rejoice that the results we have seen over the fortnight are significantly better than what was predicted after the emergence of the Delta variant. As said by Adam Sacks, president of Tourism Economics, at this week’s Americas Hospitality Sales and Marketing Association International’s (HSMAI) Revenue Optimization Conference (ROC), “travel is inevitable.”
To learn more about the data behind this article and what STR has to offer, visit https://str.com/.


Sign up to receive our stories in your inbox.
Data is changing the speed of business. Investors, Corporations, and Governments are buying new, differentiated data to gain visibility make better decisions. Don't fall behind. Let us help.


Sign up to receive our stories in your inbox.
Data is changing the speed of business. Investors, Corporations, and Governments are buying new, differentiated data to gain visibility make better decisions. Don't fall behind. Let us help.