
Today, 60% of U.S. consumers stock up on groceries online. In the wake of the pandemic, traditional grocers now compete with disruptors like Instacart and megaretailers like Walmart and Amazon. To help these retailers thrive in the cutthroat online grocery business, we use Similarweb Shopper and Research Intelligence, to compare Amazon, Walmart, Instacart, and traditional grocers.
First, let’s dig into digital growth
Web traffic to the U.S. grocery industry spiked 47% year-over-year (YoY) since the onset of COVID-19. Though traffic declined since peaking in March 2021, the pandemic still left its mark. As such, online grocery shopping is here to stay.
Traditional grocers vs. Amazon
Panic-buying in spring 2020 propelled desktop conversion rates for traditional grocers. Kroger’s conversion rate (CVR) rose 86.5% month-over-month (MoM) from 8.9% in March 2020 to 16.6% in April while Publix’s CVR surged 48.5% MoM.
For a short period, CVRs for Kroger and Publix even exceeded the grocery category of mega-retailer Walmart (/grocery) and grocery courier service, Instacart, while other traditional grocers, like Safeway and ShopRite, trailed behind.
Yet, with a CVR of nearly 21% in April 2020, Amazon’s Grocery & Gourmet category came out on top.
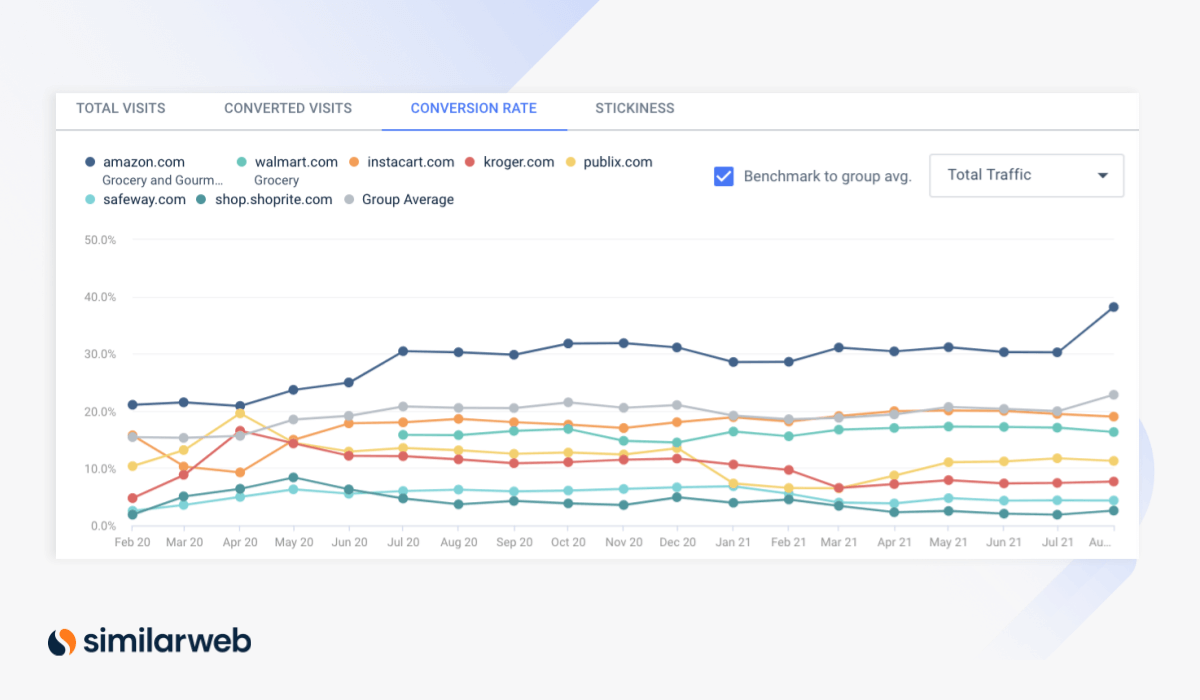
Grocery business goes to eCommerce players
The CVR for Amazon Grocery increased 81% from February 2020 to reach 38% in August 2021, helping the tech giant expand its lead over other grocery retailers.
Although traditionally thought to be Amazon’s biggest competitor, Walmart’s CVR of 16.3% trailed Instacart’s 19%, the runner-up to Amazon. Still, Instacart trailed Amazon by nearly 20 percentage points (ppts). At the same time, CVRs for Publix, Kroger, Safeway, and ShopRite’s websites lagged at 11.3%, 7.7%, 4.4%, and 2.6%, respectively, showing abandonment in the aisles.
Amazon Grocery growth exceeds other categories
When bringing mobile into the mix, the CVR for Amazon Grocery is even higher, rising 45% from 36.2% in February 2020 to 52.4% last August. This CVR growth exceeds the average of 3.1% across Amazon categories indicating the rise isn’t just due to the general growth of Amazon’s platform. In the same time frame:
So, what is Amazon doing that helped it get ahead? More importantly, will it be able to stay there?
1. Subscribe and Save rates reveal strong customer loyalty
The only metric where Amazon’s Grocery category trails the cross-category average is product views, by about 16 ppts. Product views surged 75.3% across categories vs. just 59% for Grocery, indicating consumers are doing less browsing before buying. This can be attributed to the growth of Subscribe and Save, Amazon’s subscription program.
Category revenue from the program catapulted from April 2020 ($198.8 million) to August 2021 ($720.7 million). At the same time, the percentage of total category revenue generated through Subscribe and Save nearly doubled from 12.9% to 24.6%, reflecting increased consumer demand to regularly buy discounted groceries online.
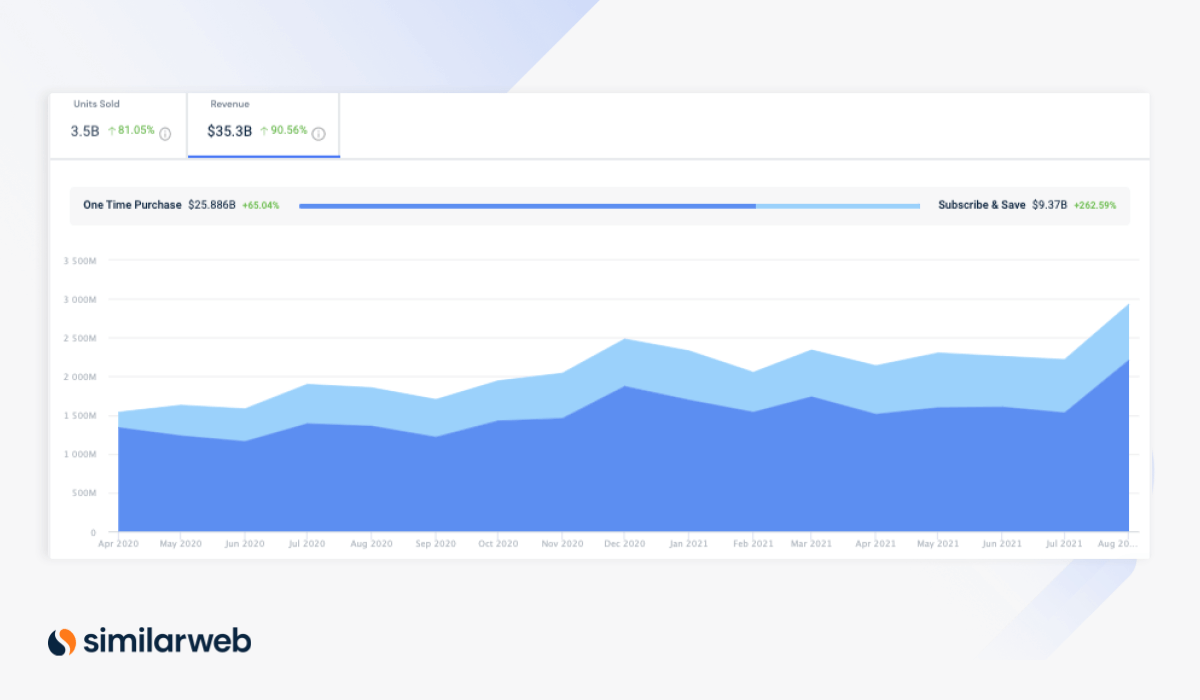
Growth of Subscribe and Save brings more recurring revenue and lowers Amazon’s customer acquisition costs (CAC). Most notably, it reflects strong customer loyalty – 83.2% of its grocery customers are returning shoppers. Additionally, the program is open to anyone, not just Prime members, pointing at its potential to reach an even larger audience.
2. In-store shopping preparations pay off
But other retailers need not abandon their carts just yet. Top trending search terms for the online grocery market actually relate to onsite locations, demonstrating consumer readiness to return to stores. In order of search volume, these searches and their MoM increases include:
Appropriately, Amazon seems prepared for consumers to trade their digital carts for physical ones – it launched Amazon Fresh physical stores in August 2020, near the height of the pandemic.
Though only a few locations opened, brand awareness seems to be growing for the new brick-and-mortar grocery arm. In fact, keyword searches for “Amazon fresh locations” grew 135% MoM in August. Though search volume was just 6.1K, we anticipate this to get stronger as Amazon Fresh expands.
Amazon Fresh vs. Whole Foods
Amazon Fresh caters to a different demographic of shoppers than those at Whole Foods stores. Most notably, Whole Foods customers tend to favor organic ingredients over the most affordable pricing, whereas those seeking value first turn to Amazon Fresh (onsite) or amazon.com (online).
The addition of Amazon Fresh strategically sprouts Amazon’s potential market share in the overall grocery business.
Losing demand for the middleman: Amazon vs. Instacart:
Rival Instacart seems less prepared than Amazon for the return to in-store shopping, contrasting its position at the height of the pandemic.
Traffic share for the courier between grocery stores rose to 18.8% of the online grocery industry, displacing Kroger from the top spot. This growth also echoed increased consumer demand to shop at local, trusted grocery retailers, using Instacart to connect them when they couldn’t physically be there.
Since then, peak traffic share has tapered off to 12.4% in August 2020, then to 9.8% in July of this year. In addition to the return of brick and mortar, this decline reflects local retailers improving their own eCommerce experiences and delivery systems.
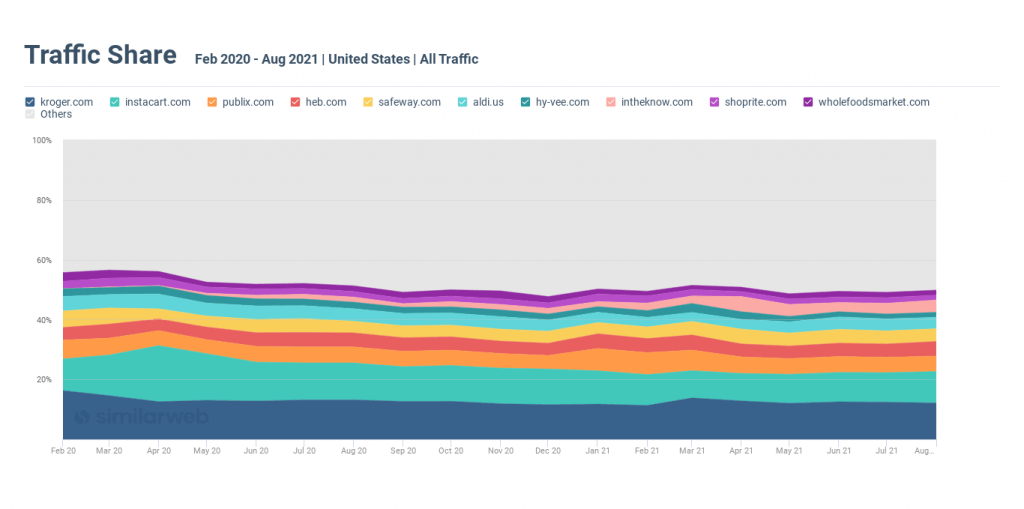
Loyalists to neighborhood grocery stores were likely eager to return to their regular vendors on-site or online and no longer needed a middleman. Kroger even re-claimed its first-place ranking with 14.6% traffic share, the most in the grocery industry.
3. Diverse online grocery brands cater to consumer preferences
Despite the unpredictable pandemic and the growth of Amazon Grocery, Amazon’s **Whole Foods (**wholefoodsmarket.com) received a steady traffic share (hovering around 1.8%) of the overall online grocery industry. This steadfastness shows strong brand loyalty and solid positioning on and offline.
While Amazon’s online grocery business is booming, Whole Foods doesn’t seem to be losing clientele. In fact, “Whole Foods” was the seventh-ranked search term for the entire online grocery industry with a search volume of 1.7 million this August, echoing its importance as a key business arm to Amazon’s long-term grocery success.
4. Growth of first-party (1P) brands brings sustained profitability
More than half of Amazon’s top five Grocery brands are 1P brands – or manufactured directly by Amazon. 1P brands boast hearty revenue sources, with profit margins 20-30% higher than third-party (3P) brands.
Whole Foods, for example, is a top 1P brand on amazon.com, with 475 million in unit sales and$2 billion in revenue since February 2020, once again reinforcing the impact and importance of consumer trust and loyalty.
Other winning 1P brands in this time frame include:
Overall, 1P units sales for Amazon’s Grocery grew 118.7% from February 2020 (63.9 million) to August 2021 (159 million) and revenue climbed 104.8% ($668 million to $1.8 billion) in the same time period.
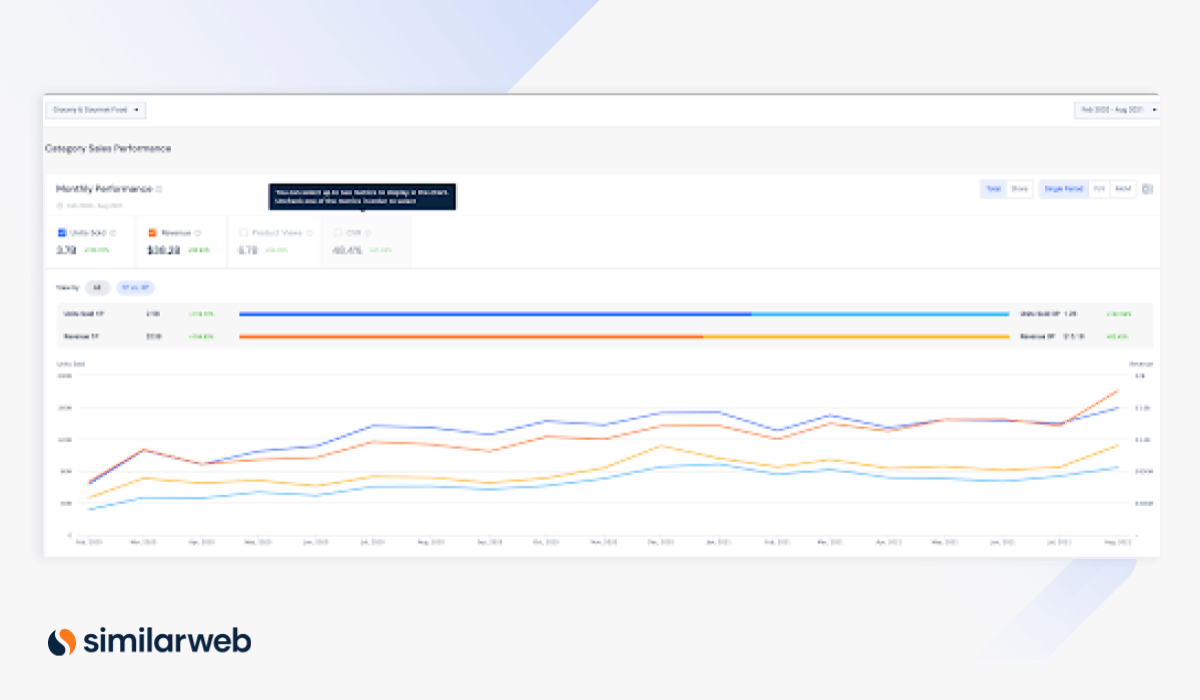
Again, the growth of 1P brands in Grocery & Gourmet exceeds the growth across amazon.com. During the same time frame, units sold grew 39.7% and revenue grew 44.5%.
These patterns indicate that grocery is a top avenue for Amazon to push its more profitable 1P brands.
When head-to-head with mega eTailer Walmart, Amazon still wins
Like Amazon**, Walmart** expanded its grocery sector. Desktop visits to Walmart’s grocery category soared 165% from 8.5 million in February 2020 to 22.5 million today.
However, there are signs that Walmart’s grocery growth is slowing down. Monthly traffic is now 7.5 million less since spiking to nearly 30 million in April 2020. Meanwhile, Amazon’s organic clicks, which also spiked that April, continue to rise.
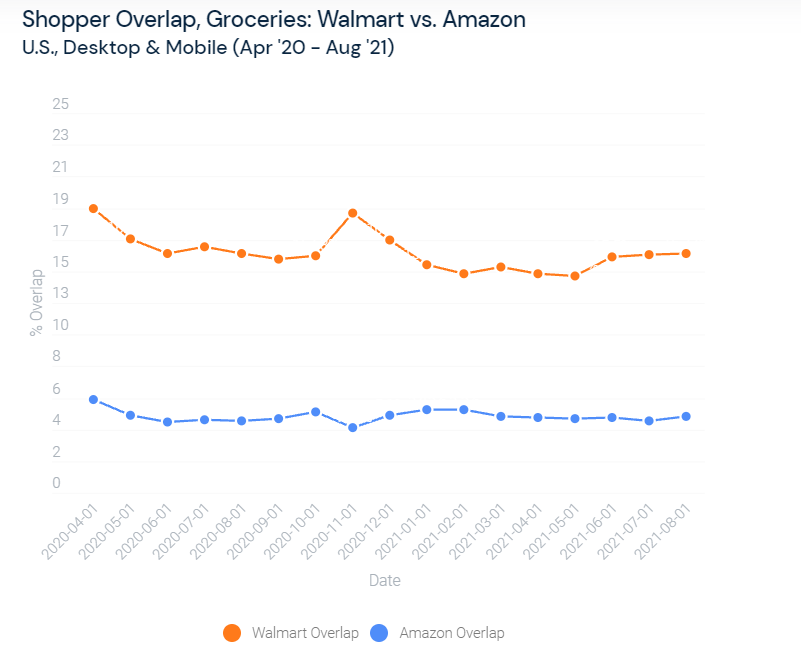
Shopper overlap
Additionally, though 15.7% of Amazon shoppers visit walmart.com for grocery products the same day, this number is down from a high of 18.7% in April 2020, suggesting that the former is gaining a stronger grip on the market.
Walmarts’ customers historically and today seem less interested in cross-shopping amazon.com for groceries. Just 4.8% visited amazon.com down from a high of 6.1% in April 2020, shoppers had fewer options to buy groceries online.
The percentage of web visits to walmart.com which go to its grocery category has grown 5 ppts from 8.5% in February 2020 to 13.2% today but is down from a peak of 16.4% in February 2021, which could have been from decreased consumer interest in leaving the house to shop in colder winter weather (we see segment share steadily rising from Nov. ‘20 ‘til this time).
Final thoughts
The online grocery industry battle continues to heat up, making the right digital intelligence increasingly important to succeed in the space.
To learn more about the data behind this article and what Similarweb has to offer, visit https://www.similarweb.com/.


Sign up to receive our stories in your inbox.
Data is changing the speed of business. Investors, Corporations, and Governments are buying new, differentiated data to gain visibility make better decisions. Don't fall behind. Let us help.


Sign up to receive our stories in your inbox.
Data is changing the speed of business. Investors, Corporations, and Governments are buying new, differentiated data to gain visibility make better decisions. Don't fall behind. Let us help.