Our Q3 Quarterly Index is now live! We analyzed a wide array of brands in several major retail categories including apparel, grocery, fitness, home improvement, and superstores to bring you the latest insights and identify trends shaping retail right now. Below is a taste of our findings.
Superstore and Grocery Sectors’ Q3 Gains
In Q2, it seemed like the pandemic disruptions were waning and the grocery and superstore spaces were returning to pre-pandemic foot-traffic patterns, until COVID cases began increasing again, causing consumer concerns about the economy to surge once more.
We dove into our Q3 Quarterly Index Reports to understand how the return of COVID and the rise in staycations affected the grocery and superstore spaces this summer.
Grocery and Superstore Visit Patterns Follow a Similar Course
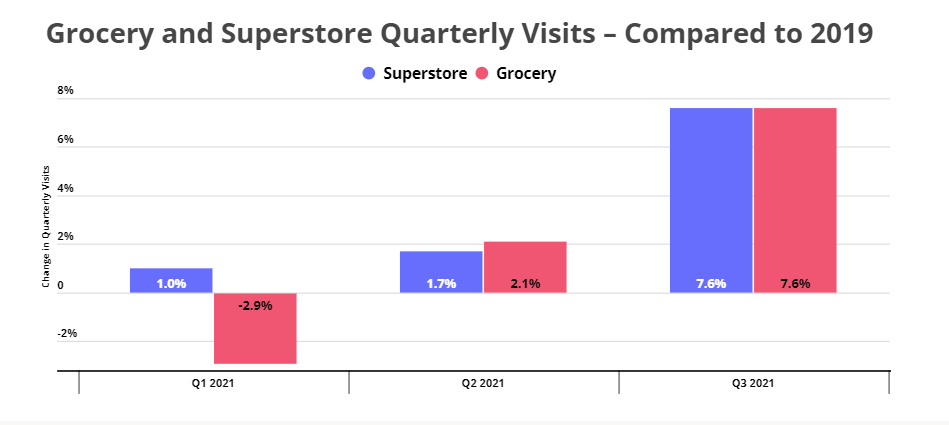
There seems to be a strong correlation between grocery and superstore visit growth with both sectors showing strength in Q3. Grocery and superstore visits each climbed by 7.6% compared to Q3 2019 while dining visits dropped – likely a result of rising COVID cases in late Q3. The rise in grocery and superstore visits was likely driven by a combination of forces including a reopened retail environment, the summer season and even potentially the rise of COVID cases. The increase in staycations this summer probably also contributed to the visit growth, as the ongoing pandemic continued throwing a wrench in vacation plans. The impressive visit increase also indicates that the ecommerce boost the grocery and superstore sectors saw doesn’t necessarily pose a long-term threat to brick and mortar visits.
But sectoral differences earlier this year show that despite the similarities, grocery and superstores’ growth trajectories are not identical. The hike in grocery visits seems more volatile, with year-over-two year visits decreasing by 2.9% in Q1 only to rise by 2.1% in Q2. The superstore increase is slower and steadier, with visits rising by 1.0% in Q1 and by 1.7% in Q2 when compared to 2019. This speaks in part to the unique strength that superstores possess in addressing such a wide range of needs from grocery to apparel and even home goods. But it also speaks to the widespread distribution of locations enabling them to balance declines in harder hit areas with increases elsewhere. In grocery, the regional nature of many chains limits this, pushing some to see weakness when an area is particularly affected by COVID or weather.
Year-Over-Two-Year Visit Hike for Superstores
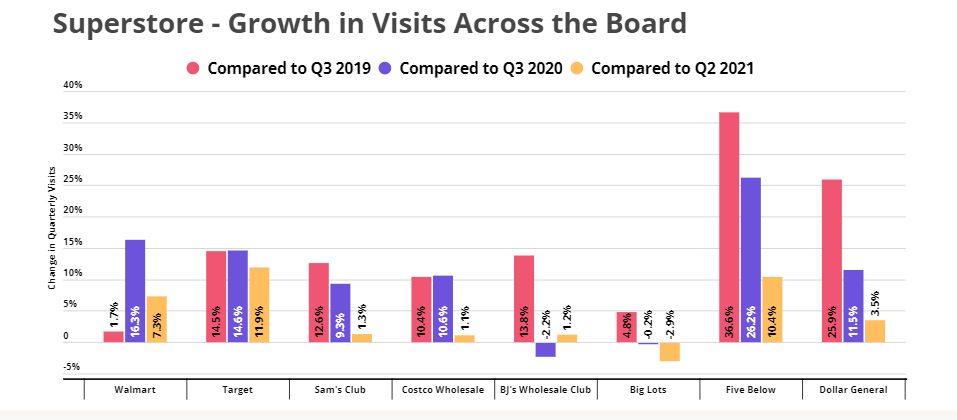
Another indicator of the superstore category’s improved long-term position is the across-the-board increase in year-over-two-year visits in Q3. Both the discount superstores and wholesale clubs saw a significant increase in foot traffic, showcasing the current strength of the sector as a whole.
Five Below led the visit growth, with a year-over-two-year visit increase of 36.6%, and Dollar General trailed close behind, with 25.9% growth compared to 2019. BJ’s Wholesale Club led the visit growth among the wholesale retailers, with a 13.8% rise in visits compared to Q3 2019, followed by Sam’s Club with a 12.6% year-over-two-year growth in quarterly visits. Target also showcased its impressive strength quarter, with visits climbing by 14.5% compared to Q3 two years ago.
Boost to Grocery Visits Across Regions
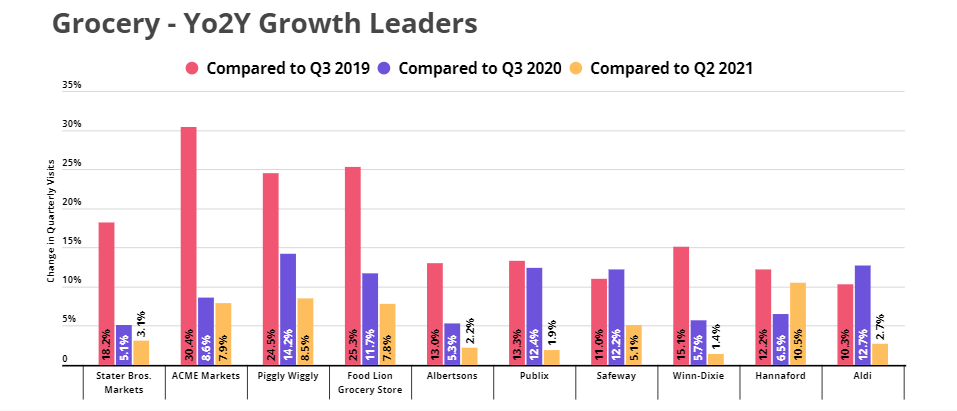
The grocery visit hikes may not have been quite as sweeping as in the superstore category, but the brands analyzed nevertheless saw significant visit hikes across many different regional players. Of the brands analyzed, ACME Markets (mid-Atlantic) saw the biggest year-over-two-year increase, with Q3 visits 30.4% higher than Q3 2019 visits, followed by Food Lion Grocery Store (mid-Atlantic and southeast) with a 25.3% rise in visits and and Piggly Wiggly (midwest and southeast) with a 24.5% increase in year-over-two-year visits.
California-based Stater Bros. Markets also saw a visit hike of 18.2%, while visits to Florida-based Publix rose by 13.3% compared to 2019. The Maine-based Hannaford chain saw a 12.2% increase in foot traffic, while Albertsons, headquartered in Boise, Idaho, saw a year-over-two-year visit hike of 13.0%. The variety of regional leaders and chain sizes represented in the graph below indicates just how widespread the rise in grocery visits truly was.
Will grocery and superstore visit patterns continue to sync? Will the superstore visit hike last once the current COVID wave subsides?
To learn more about the data behind this article and what Placer has to offer, visit https://www.placer.ai/.


Sign up to receive our stories in your inbox.
Data is changing the speed of business. Investors, Corporations, and Governments are buying new, differentiated data to gain visibility make better decisions. Don't fall behind. Let us help.


Sign up to receive our stories in your inbox.
Data is changing the speed of business. Investors, Corporations, and Governments are buying new, differentiated data to gain visibility make better decisions. Don't fall behind. Let us help.