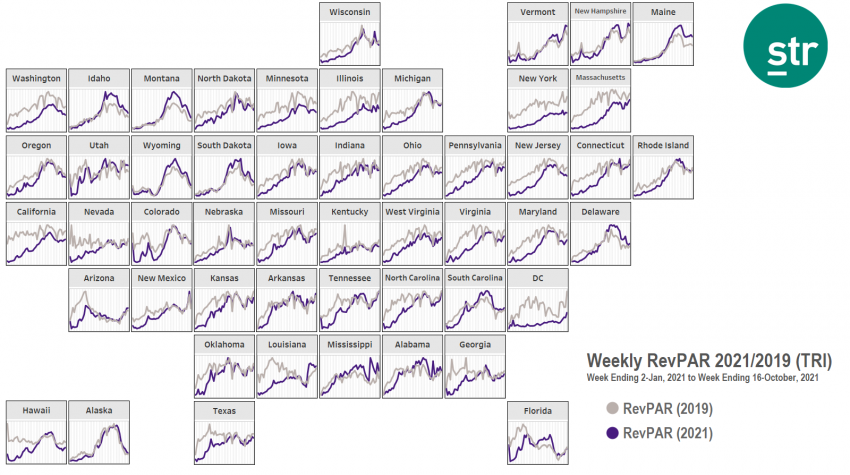
STR’s latest 51-chart map shows a variety of recent national/regional trends as well as the general pace of the industry’s continued recovery.
During the early weeks of autumn, revenue per available room (RevPAR) on a total-room-inventory (TRI) basis looked like 2019 for more markets. For the four weeks ending 16 October, 18 states outperformed their comparable 2019 RevPAR. That number was down from 21 states last month, but if we widen to “close misses” (i.e., an index score of 90 or higher), 37 states showed at least respectable returns toward their normal RevPAR.
Compared with 2019, the best recent four-week RevPAR surpluses occurred in Montana and Maine (both indexing 138) followed by Mississippi (123).
In terms of month-over-month change, Washington D.C. experienced the sharpest average RevPAR percent/dollar upturn, rising 63% from $69 to $113. However, D.C.’s indexed RevPAR score was just 50. Although that value was up 9 points from the previous month, RevPAR is still only half of 2019 levels. New York State is also still behind the pace, losing 4 points in its indexed RevPAR (60) as a result of lower business compared with typical early fall weeks.
As expected, this fall’s slow return of conferences/group bookings has held back most markets’ weekday performance. Stronger weekend performance, in contrast, has provided a much-needed boost to overall industry indicators.

To learn more about the data behind this article and what STR has to offer, visit https://str.com/.


Sign up to receive our stories in your inbox.
Data is changing the speed of business. Investors, Corporations, and Governments are buying new, differentiated data to gain visibility make better decisions. Don't fall behind. Let us help.


Sign up to receive our stories in your inbox.
Data is changing the speed of business. Investors, Corporations, and Governments are buying new, differentiated data to gain visibility make better decisions. Don't fall behind. Let us help.


