
Week ending 23 October
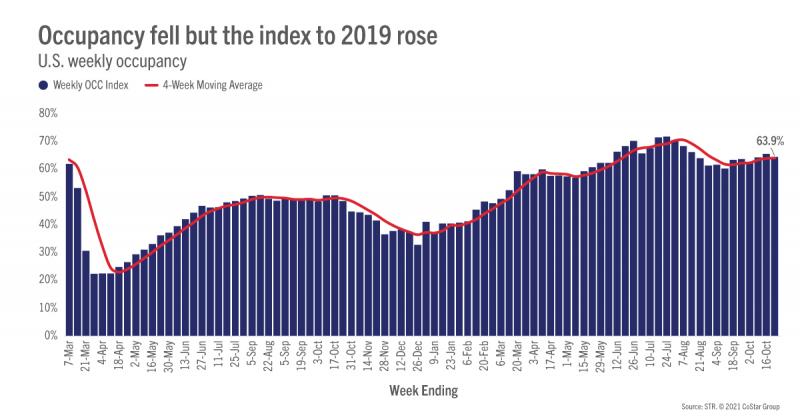
For the week ending 23 October, U.S. hotel occupancy tumbled slightly to 63.9% from 65.0% in the previous week. The decline was driven mostly by a weaker Sunday, down five percentage points week on week, after Sunday had driven the previous week’s performance due to the Columbus Day holiday. The weekend was also soft, falling two percentage points after dropping one percentage point in the previous week. There is good news, however. Monday through Thursday occupancy improved for a third consecutive week, which we believe is a result of rising business travel. Occupancy increased 0.5 percentage points to 61% on those four days. Some may argue that the four-day gain was a result of a weak Monday in the previous week, due to the aforementioned holiday. However, Tuesday through Thursday was also up and slightly stronger than the four-day period with occupancy at 62%. And, despite the decrease in the total week’s occupancy, the index to 2019 increased by a point. In 2019, weekly occupancy fell by two percentage points versus the one percentage point decline this week.
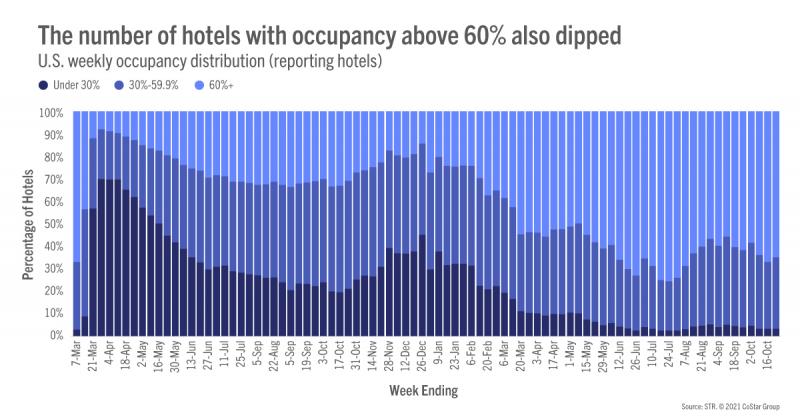
While there is growing evidence of business travel, leisure travel remains a strong driver of performance. Grouping the days of the week into three categories, “Start” (Sunday & Monday), “Work” (Tuesday-Thursday) and “Weekend” (Friday & Saturday), we found that weekends have showed the most resilience with occupancy of 77% in the past six weeks. Work days occupancy has been steadily increasing over the past six weeks after bottoming out the week of Labor Day. A similar trend was seen in the Top 25 Markets, where the week’s work days averaged 60% occupancy with key business centers (Boston, Los Angeles & New York City) above 65%. Start day occupancy has been steadfast over the period at 55%. As compared with 2019, however, start days are relatively stronger with an index of 89 versus 84 for work days. The index for weekends has averaged 98 over the past six weeks and about the same from Memorial Day on.
Rightly so, most of our focus has been on demand, but another standout metric has been average daily rate (ADR). ADR relative to 2019 continues to beat expectations. Since the week before 4th of July, an average of 77% STR-defined markets have seen weekly ADR higher than what it was in 2019. While the index and the number of markets above 2019 levels peaked in the summer, the fall hasn’t seen the decline that many anticipated. In the latest week of reporting, 77% of markets reported ADR above the comparable week of 2019. Of course, some of the ADR growth is a result of inflation and other cost pressures. Considering inflation, real ADR has been above 2019 levels in an average of 56% of STR-defined markets over the past 17 weeks with 55% of markets reporting higher ADR last week than in 2019. Overall, the index rose during the week even as ADR itself was basically flat week over week.
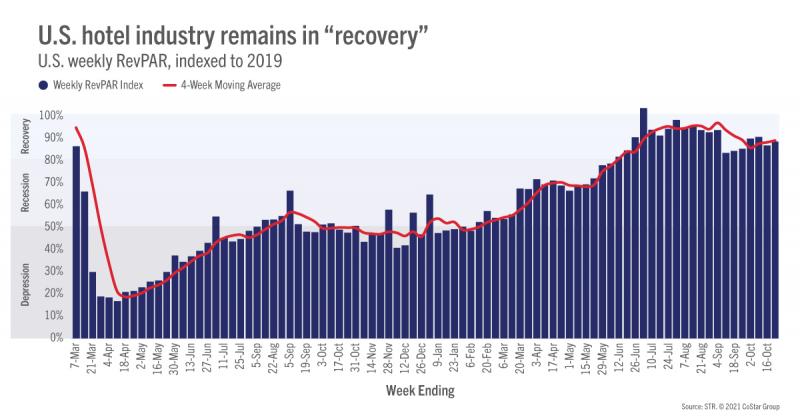
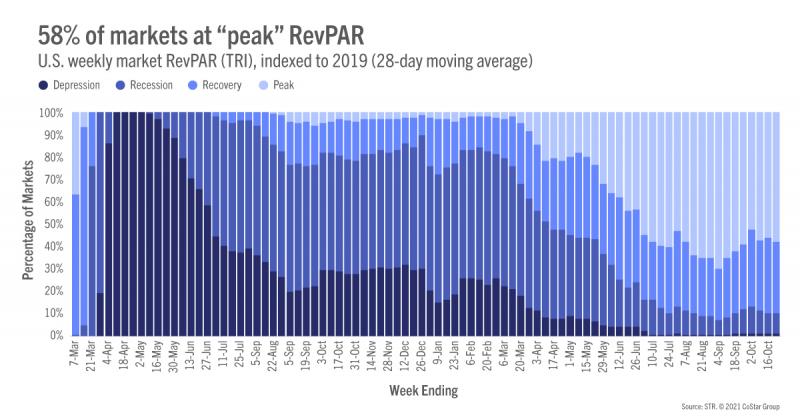
Revenue per available room (RevPAR) fell for the first time in three weeks, dropping 1.6% week on week. As with the other KPIs, the index to 2019 rose moderately with weekly RevPAR at 90% of 2019’s comparable week. On an inflation-adjusted basis, real RevPAR indexed to 2019 was at 85. The index has been above 80, STR’s “recovery” threshold, for the past 21 weeks on a nominal basis and 19 weeks using inflation-adjusted methodology. Using a 28-day moving average, 58% of STR-defined markets were at “peak” RevPAR (RevPAR indexed to 2019 above 100). Over the past 17 weeks, an average of 60% of markets have been at “peak” RevPAR in any given week. Throughout this period, only two markets have almost consistently remained in “depression” (RevPAR indexed to 2019 below 50): San Francisco and San Jose.
Outside the U.S.
Occupancy outside the U.S. increased in the week to 46% on a total-room-inventory basis (TRI) and to 57% among open hotels (standard methodology). The U.K continued to show the highest TRI occupancy (64%) among the 10 largest countries based on hotel supply. Germany and China were both in the mid-50s, while Canada stayed below 50% but saw a week-on-week gain after four consecutive weeks of declines.
Expo 2020 hosted in Dubai, which started on 1 October and will continue until 31 March 2022, is driving growth in both occupancy and ADR. The market saw its highest pandemic-era weekly occupancy at 87.5% among open hotels. ADR for the week came in at AED840 (US$229), the highest levels since 2020 Christmas and New Year holidays, when Dubai saw large boost as it was one of the only leisure destinations opened.
Melbourne celebrated as the market exited its sixth lockdown on Friday, 22 October. TRI occupancy remained relatively low but improving as Friday produced a 6% increase versus the previous Friday to 21.5%, and Saturday showed a 10% increase versus the prior Saturday to 22.0%. ADR was boosted similarly, up 7% on Friday and 10% on Saturday week on week. Restrictions will ease further from 29 October, which includes opening travel between regional Victoria and Metropolitan Melbourne, which should further boost recovery.
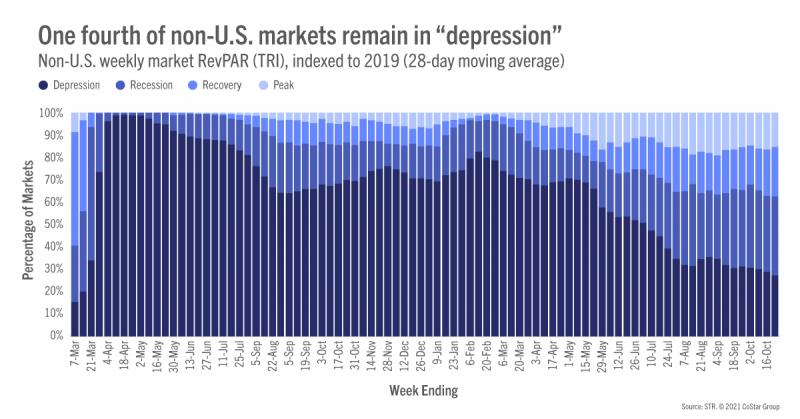
Market-level TRI RevPAR remains elusive with most markets lingering in STR’s “depression” category but the percentage of markets there is slowly declining. For the week ending 23 October, 27% of markets were in “depression” versus 29% a week prior. More than a third of markets are in “recession” (RevPAR indexed to 2019 between 50 and 80) with 22% in “recovery” (RevPAR indexed to 2019 between 80 and 100) and 15% at “peak.”
Big Picture
This week’s occupancy decrease in the U.S. was disconcerting but not unexpected given a similar trend was seen in 2019. Demand and occupancy are holding up well as is ADR. Next week’s results could also see a further softening, but its 2019 comparisons should be favorable as Halloween fell on a Thursday that year, significantly reducing demand. With this year’s festivities occurring on the weekend, the impact should be less. We continue to be encouraged by the resiliency of travel and of hoteliers focused on revenue and profitability.
To learn more about the data behind this article and what STR has to offer, visit https://str.com/.


Sign up to receive our stories in your inbox.
Data is changing the speed of business. Investors, Corporations, and Governments are buying new, differentiated data to gain visibility make better decisions. Don't fall behind. Let us help.


Sign up to receive our stories in your inbox.
Data is changing the speed of business. Investors, Corporations, and Governments are buying new, differentiated data to gain visibility make better decisions. Don't fall behind. Let us help.