
Week ending 30 October
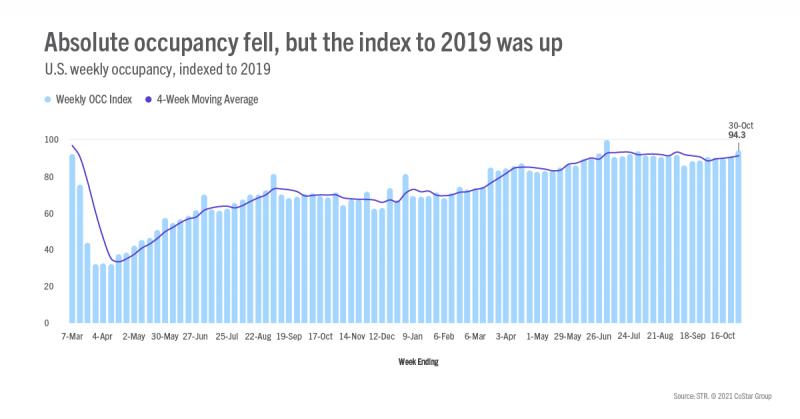
U.S. hotel performance for 24-30 October was neither a trick or treat as occupancy dropped to a 25-week low of 58.9% after coming in at 63.9% in the prior week. The decrease was anticipated due to Halloween, which always negatively impacts demand. The decline was most pronounced on the weekend, given that the holiday was on Sunday. Weekend occupancy tumbled down by 10 percentage points week on week versus three percentage points during the remaining days.
Despite the low absolute level, weekly occupancy indexed to 2019 increased, from 91 to 94. That week-to-week improvement is because Halloween 2019 fell on a Thursday, which impacted more days of that week with less business and group travel. Weekend travel after Halloween 2019 was mostly unscathed. In fact, the drop in this year’s weekday occupancy was like 2019’s weekend decline. If this had been a normal year in terms of business and group demand, it’s easy to surmise that the Halloween impact would have been substantially less and relegated to the weekend. However, that may not hold true.
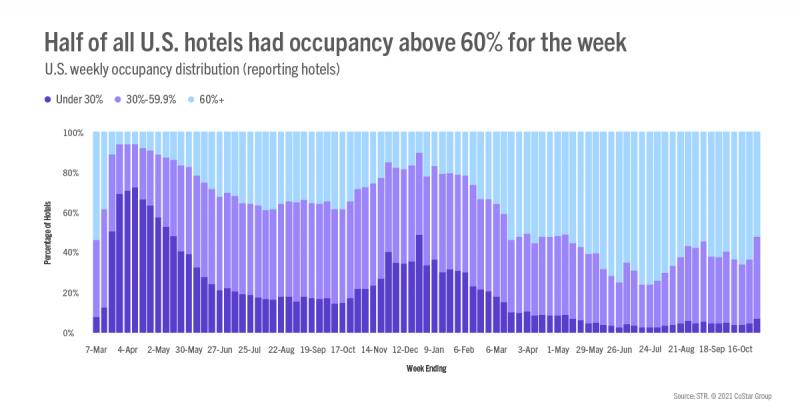
The last time Halloween fell on a Sunday was in 2010, and that year was a lot like 2021 with rebuilding from the Great Recession. It is uncanny how similar 2010 weekly performance compares with this year. The week before Halloween 2010, occupancy was 63.8%, which was nearly identical to this year’s level (63.9%). Given that same starting point, 2021’s performance looks better than what a casual review of the numbers suggest. In the week ending 30 October 2010, weekly occupancy fell by six percentage points to 57.8% versus the five-percentage point drop just observed in 2021. Weekday occupancy was slightly stronger in 2010, by 1.4 percentage points, but 2021 weekend occupancy was far better at 65.7% compared with 2010’s 57.9%. More than 70% of all reporting hotels saw occupancy above 60% over the weekend with 65% reporting that level of occupancy or more on the weekdays. Thus, even with Halloween, we can say that demand held up well, which is encouraging.
Average daily rate (ADR) also fell, dropping 5% from the previous seven-day period. Like what was seen with the occupancy index, ADR indexed to 2019 gained two points. The ADR index has increased in five of the past six weeks, and when adjusted for inflation, the index was at its highest level of the past three weeks. The week’s ADR decrease, however, was higher than what was seen in 2010 when weekly ADR fell only 1.2%. The decline was much more severe on the weekend when ADR dropped 8.8% versus 3.2% in 2010, which is surprising given the higher occupancy level seen this year versus then. The drop was driven by hotels outside of the Top 25 Markets, where weekend ADR fell 10.5%. Even with the large decrease, weekend ADR was 15% higher than in 2010 (adjusted for inflation) whereas weekday ADR was slightly below the levels seen 11 years ago.
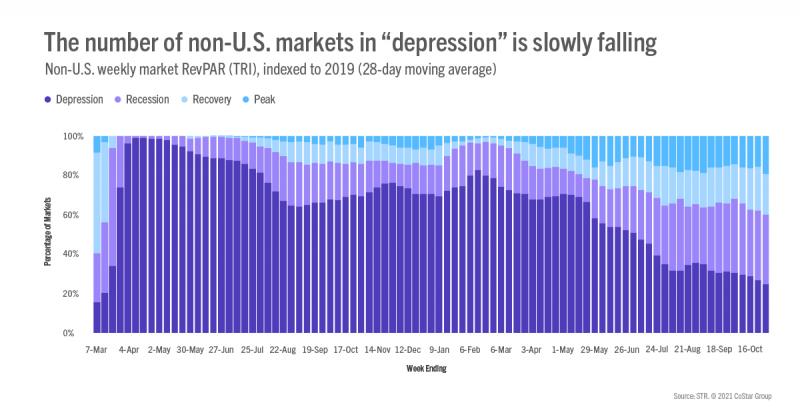
Weekly revenue per available room (RevPAR) slumped by its largest amount since the start of the year (-12.3%) with the index to 2019 rising 5.1 points to 96 thanks to an easy comparison. On an inflation-adjusted basis, 90 markets had weekly RevPAR that was higher than what it was in the comparable week of 2019. On a 28-day moving average, 77 markets were at “peak” RevPAR (RevPAR indexed to 2019 >100) on an inflation-adjusted basis, the most of the past six weeks. Another 61 markets were in “recovery” (RevPAR indexed to 2019 between 80 and 100), 26 were in “recession” (RevPAR indexed to 2019 between 50 and 80) and two (San Francisco & San Jose) remained in “depression” (RevPAR indexed to 2019 <50) as they have since the start of the pandemic


Outside the U.S.
Outside the U.S., occupancy on a total-room-inventory (TRI) basis fell to a six-week low of 44% (-3.5 percentage points week on week) among the 104 countries tracked on a weekly basis. ADR, however, rose 2% during the week. In the 10 largest countries by hotel supply, occupancy was a bit stronger (45%), but the weekly decline was steeper (-4.6 percentage points). The ADR increase in the top 10 was similar to the rest of the world.
The U.K. continued to report the highest occupancy among the top 10 (68.5%), up slightly from the previous week. Glasgow, hosting the U.N. Climate Change Conference (COP26), showed its highest weekly performance since the pandemic began with occupancy at 80%. Edinburgh is also benefiting from the event with weekly occupancy at 85%. For both markets, occupancy was well above 2019 levels.
Occupancy in China fell nearly 10 percentage points to 44.3%, a three-week low. In Beijing, where COVID restrictions were tightened after new cases emerged, occupancy fell to 42% from 71% the week prior. China’s ADR held strong at just 6% behind last year and 3% behind 2019 levels.
Canadian occupancy also tumbled to 44%, its lowest level of the past six weeks. The decrease was seen across all markets ranging from 0.5 percentage points in Vancouver to 10 percentage points in Vancouver Island.
Other markets of note included Rome, which saw its highest weekly performance since COVID due to the G20 meeting. Occupancy there reached 67% for the week. Dubai maintained strong occupancy thanks to Expo with this week’s level at 87%. ADR also strengthened week over week, up 13% versus last week and 27% ahead of 2019 levels.
Big Picture
While the U.S. saw a drop in performance, we shouldn’t be discouraged given that a similar trend was seen the last time Halloween fell on a Sunday, which was also during a rebuilding year. Based on 2010’s results, we should expect a slight uptick in the upcoming week’s performance. Of course, we should be prepared for lower occupancy in the coming weeks as we head to the end of the year. The holidays are still expected to be stronger than normal as people reconnect and make up for the lost holiday season of 2020.
To learn more about the data behind this article and what STR has to offer, visit https://str.com/.


Sign up to receive our stories in your inbox.
Data is changing the speed of business. Investors, Corporations, and Governments are buying new, differentiated data to gain visibility make better decisions. Don't fall behind. Let us help.


Sign up to receive our stories in your inbox.
Data is changing the speed of business. Investors, Corporations, and Governments are buying new, differentiated data to gain visibility make better decisions. Don't fall behind. Let us help.