
Week ending 6 November
The hotel industry rebounded slightly after two weeks of declines, gaining nearly a percentage point in occupancy during the week ending 6 November. The uptick was expected given that history shows a similar pattern after a Halloween Sunday. Of course, due to Halloween, Sunday demand was down significantly with decreases also seen on Monday, Tuesday and Wednesday. Week over week, average daily rate (ADR) was nearly flat (+0.2%) and revenue per available room (RevPAR) increased 1.8%. Even with that slight growth, indices to the comparable period in 2019 showed a sharp decrease, with the 2019 RevPAR index falling to a 21-week low.
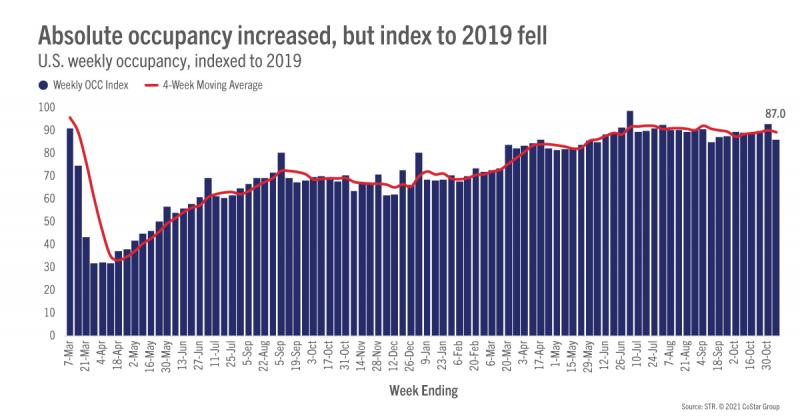
While the drop in the indices may ring a negative tune, we do not believe it’s a harbinger of a new wave of industry weakness. Reviewing the same week in 2010 where Halloween also fell on a Sunday, demand patterns were relatively similar with occupancy falling sharply on Sunday and declining through Tuesday. Recall, 2010 is a mirror to 2021 as the calendar days are the same, and it too was a rebuilding year after the Great Recession. Unlike 2010, however, this week’s performance was stronger as occupancy reached 59.8% versus 58.2% in 2010. Leisure demand continued to be the primary driver of performance and its strength was very apparent. On Halloween Sunday in 2010, occupancy managed to rise to just 39.8% versus this year’s 45.2%. Weekend performance was also much stronger, with occupancy up nine percentage points as compared to 2010. Tuesdays and Wednesdays in 2021 underperformed 2010 with a nearly five-percentage point difference, illustrating the ongoing weakness in the business transient segment.
While weekday occupancy was down compared to 2019 and 2010, we were delighted to see a slight improvement in performance within the Top 25 Markets. In the past two weeks, occupancy in the Top 25 has been higher than those outside of the Top 25. This is the first time that the Top 25 Markets have outperformed all other markets for two consecutive weeks since the onset of the pandemic. The Top 25 accounted for 52% of the total demand growth this week and saw higher week-over-week ADR (1.1%) and RevPAR (2.5%) growth than all other markets combined.
When looking at the Top 25 Markets, New Orleans and Phoenix recorded their highest weekly revenues since the start of the pandemic, while Houston and New York saw their second-best weekly revenue levels. Further, New York had its highest weekend occupancy (83%) since the weekend of Presidents Day 2020, and also experienced its second-highest weekly occupancy (68%) since early 2020.
As stated earlier, week-over-week ADR was flat, but when excluding Halloween Sunday, ADR increased 1.2% with the Top 25 observing slightly better growth at 1.7%. Despite this, there was still concerning weakness when looking at Tuesday – Wednesday, when ADR fell nearly 2% for a second consecutive week. The Top 25 also saw midweek ADR decline, but to a slightly lesser extent. U.S. weekend ADR was up 3.4%, whereas the Top 25 climbed 4.4%. Given total weekly ADR saw limited movement this week, it’s not surprising that only 45% of markets continued to report inflation-adjusted (real) ADR above 2019 levels – the lowest weekly percentage of the past 20 weeks. Over the last 28 days, however, 52% of markets reported real ADR above 2019, falling in line with previous results.
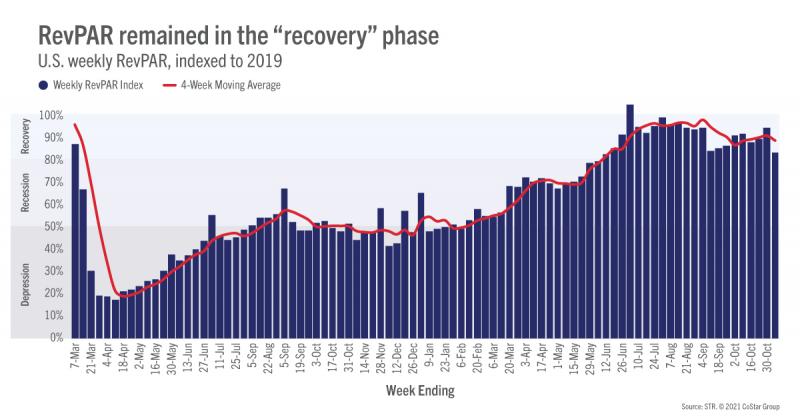
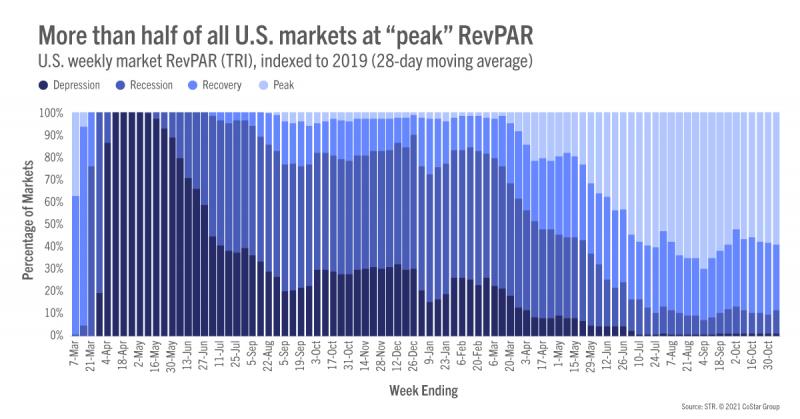
A week ago, the 2019 RevPAR index was at 96. This week, the index declined to 84, remaining in STR’s “recovery” category for a 23rd consecutive week. “Recovery” is defined as RevPAR indexed to 2019 between 80 and 100. Unfortunately, for the first time in eight weeks real RevPAR indexed to 2019 fell into the “recession” category, coming in below 80 but above 50. In the 28 days ending 6 November, 43% of markets had real RevPAR above 2019, the “peak” category. Thirty-nine percent of markets had real RevPAR in “recovery”, while 17% of markets were in “recession.”
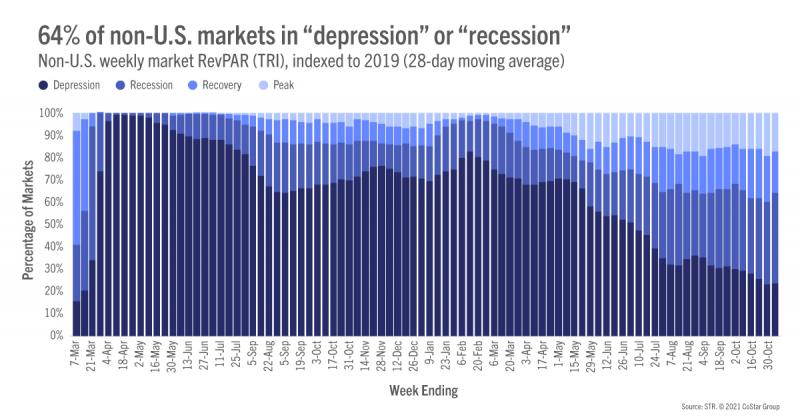
Outside of the U.S.
Occupancy continued to dip outside of the U.S., falling to 40% on a total-room-inventory (TRI) basis. For a 15th consecutive week, the U.K. had the highest occupancy (61%) of the ten largest countries based on supply, but the metric fell eight percentage points week over week. Canada also saw occupancy decrease just slightly, down 0.5 percentage points to 44%. China’s occupancy level (36%) declined for a second straight week, falling to a 10-week low.
On a more positive note, Australian markets are coming back to life. ACT & Canberra Area, New South Wales, Sydney Surrounding, and Victoria all saw strong week-over-week occupancy rebounds. The metric in Melbourne and Sydney, however, remained stagnant in the 25-30% range.
Glasgow and Edinburgh continued to see strength from the U.N. Climate Change Conference (COP26). Glasgow’s occupancy reached 92%, up 14% versus 2019, whereas Edinburgh reported a level of 81%, up 12% versus 2019. ADR was also on the rise with both markets achieving their highest weekly ADR on record.
Big Picture
Optimism abounded at this week’s NYU International Hospitality Industry Investment Conference where STR and Tourism Economics released their latest hotel industry forecast. The hotel industry is now anticipated to surpass 2019 demand and ADR levels in 2022, with RevPAR doing the same in 2023. On a real basis, ADR and RevPAR are not expected to top their previous peaks until after 2025. Despite ups and downs, the weekly data supports both the optimism from speakers and the forecast. As we end the year, occupancy will continue to see a seasonal downward trend, but the holidays are likely to see stronger growth than in previous years.
To learn more about the data behind this article and what STR has to offer, visit https://str.com/.


Sign up to receive our stories in your inbox.
Data is changing the speed of business. Investors, Corporations, and Governments are buying new, differentiated data to gain visibility make better decisions. Don't fall behind. Let us help.


Sign up to receive our stories in your inbox.
Data is changing the speed of business. Investors, Corporations, and Governments are buying new, differentiated data to gain visibility make better decisions. Don't fall behind. Let us help.