Source: https://www.placeiq.com/blog/
We hope you all had a wonderful Thanksgiving, at home or visiting loved ones. Last week, holiday travel surged back to levels just shy of our 2019 pre-COVID benchmark. Compared to 2020 people were more likely to travel, traveled significantly further, and returned to airports en masse.
Today, we’ll break down the pilgrimage for you all. But first, let’s touch on the big topic of the hour: the potential of the Omicron variant. There’s still so much we don’t know, but there’s some scenario planning we think is valuable for marketers as we stare down the idea of a new COVID wave.
A Word on Omicron
Everywhere you turn, there’s talk of the Omicron variant. With a scary amount of mutations on the key spike protein, we’re all waiting with bated breath to learn how much more transmissive it is, whether or not it can effectively evade vaccines, and the severity of its symptoms. Insight into these issues is frustratingly slow — cases progress and labs analyze more slowly than the immediacy of our news media — but for now I want to discuss what marketers should do if another wave of cases similar to Delta ripples through the United States.
We cannot predict how Omicron might spread, but we can predict how consumers will likely react to an uptick in cases. The one upside of this pandemic’s longevity is that we’ve now accrued enough data that we can see patterns repeat. And this is the pattern we’ve seen twice now:
We’ve even prepared a nice graphic summing up this pattern for you to print out and tape to the wall of your cubicle, office, basement, or wherever it is you work these days:
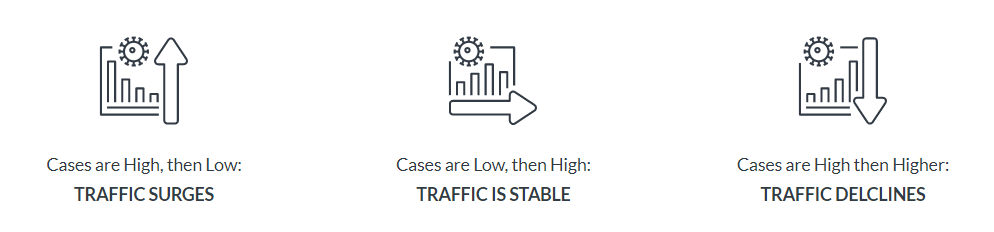
We’ve seen this before and we expect this pattern to occur again. When we consider Omicron or any other winter surge, we encourage you to especially keep the second tenet in mind: when cases are low then go high, traffic remains stable. In the last 18 months we’ve watched many teams take their media spend to zero, then regret it later when traffic didn’t miss a beat and they lost market share.
But if you are wary — and there’s plenty to be wary about, with so many unknowns — we do have a hack to let you have your cake and eat it too: our Social Distancing audiences, specifically our Reemerged and Cautiously Reemerging segments. By limiting your targeting to audiences with higher risk tolerances, who continue to be active, you can tune your campaign to those people you know will continue to shop, dine out, or travel…given the current conditions on the ground. Capture the customers who are already venturing out. If you must cut back, do so by not targeting those who chose to remain home.
Thanksgiving Travel Returns to Form
Speaking of leaving home: we did so in droves last week. TSA screening volumes registered highs of over 95% of 2019 norms, hitting highs it hasn’t reached since before COVID:
TSA Checkpoint Volume, 7 Day Moving Average
TSA checkpoint counts in 2021 hit 95% of 2019 levels during the Sunday before Thanksgiving and didn’t dip below 87% of pre-COVID norms until Black Friday.
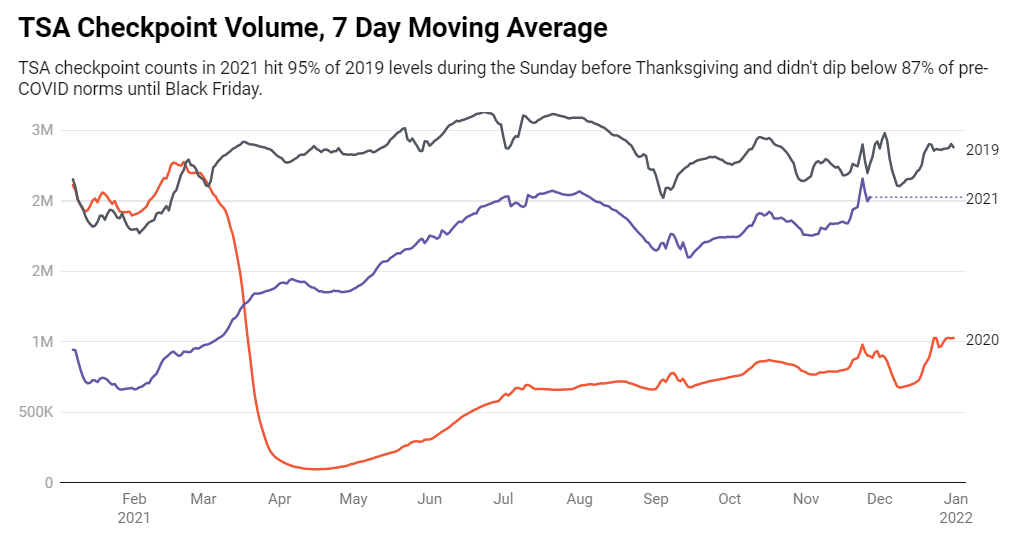
Last year people traveled, but they kept closer and eschewed airports. Look at those TSA figures again: traffic more than doubled last week compared to 2020. Relatedly, they went much further from home than last year. Trips taken more than 250 miles away from home are about 95% of 2019 volumes:
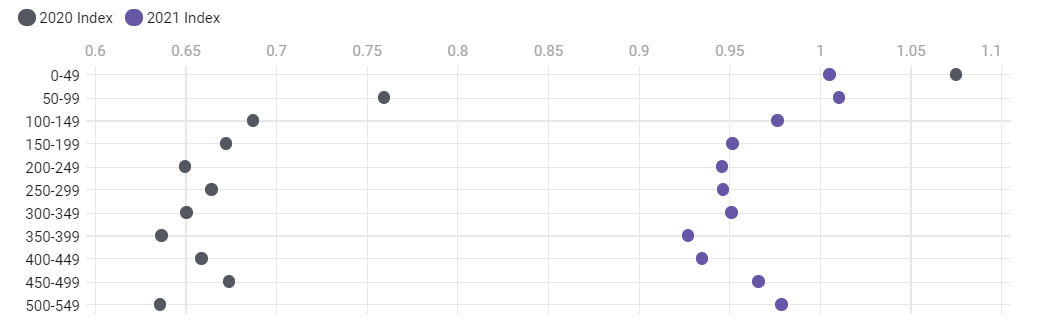
Distance Traveled from Home for Thanksgiving vs 2019
When compared to the pre-COVID benchmark of 2019, we can see dramatic increases in travel during thanksgiving week. The amount of people over 500 miles increased 35 basis points and is just shy of its 2019 normal.
And the enthusiasm spread to hotels, which came within one point of its high, compared to 2019:
Travel & Entertainment Category Reemergence
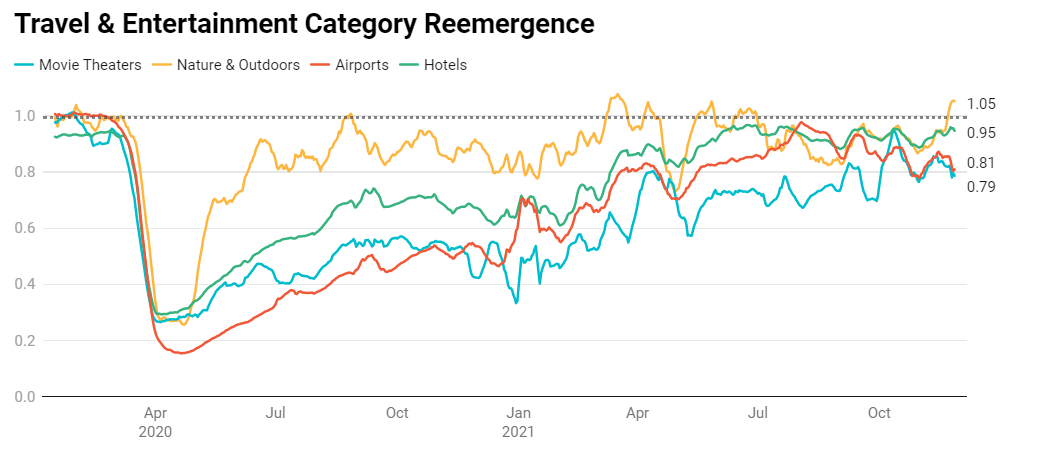
Thanksgiving travel was ripe to come back: it doesn’t require hitting big cities or visiting crowded venues. It’s gathering in residential places with people you know. And it happened to occur at a time when cases were at their lowest in nearly 6 months. The level of return to airports shocked us, though.
Interestingly, the gains were pretty uniform across the nation. Looking at the top 100 counties, even the lowest performing counties compared to 2019 were all close to 90%:
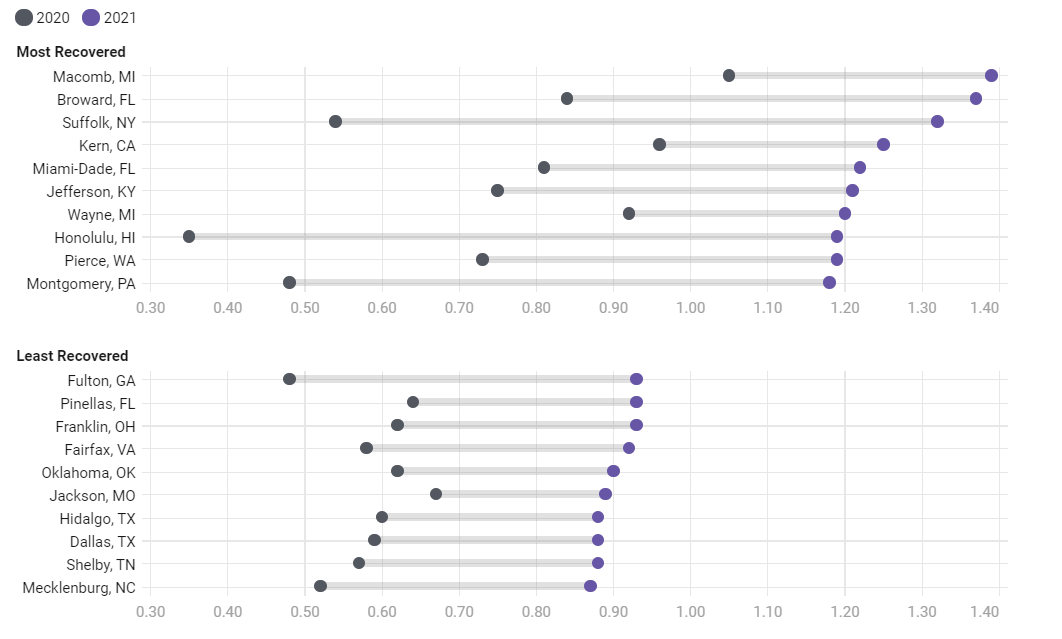
Thanksgiving Long Distance Travel by County vs 2019
Long distance travel for Thanksgiving recovered significantly across the nation in 2021. When indexed against 2019, even the lowest performing major counties were all less than 15 basis points away from 1.0.
The unified rebound in travel distances and a surging return to airports indicates a decline in travel hesitancy. People are visiting relatives they haven’t seen in years and reviving postponed plans. This gives strong license to hotels, airlines, and the rest of the travel industry to be more forward and optimistic with messaging.
One tactic well suited to this strategy is our Recapture Travel Audience: we identify devices which used to visit hotels and airports often but then abruptly stopped around 18 months ago. Reaching out to this segment and reminding them about the pleasures of travel is a conversation worth kicking off.
To learn more about the data behind this article and what PlaceIQ has to offer, visit https://www.placeiq.com/.


Sign up to receive our stories in your inbox.
Data is changing the speed of business. Investors, Corporations, and Governments are buying new, differentiated data to gain visibility make better decisions. Don't fall behind. Let us help.


Sign up to receive our stories in your inbox.
Data is changing the speed of business. Investors, Corporations, and Governments are buying new, differentiated data to gain visibility make better decisions. Don't fall behind. Let us help.