
Thanksgiving week for the U.S. hotel industry was record-breaking by all measures. Weekly occupancy topped 53%, which was 2.3 percentage points higher than the holiday week in 2019 and nearly a point higher than the previous record achieved in 2018. Thanksgiving Day occupancy (56.9%) fell a bit short to 2018’s level (57.3%) as did Monday’s, but occupancy on the other days of the week were at record highs. Looking at the 3-day weekend (Thursday to Saturday), occupancy reached 60.2%, 0.9 percentage points greater than in 2018 and 2017 which had been the bar to surpass. Weekend (Friday and Saturday) occupancy (62%) was also at a new high for the week of Thanksgiving.
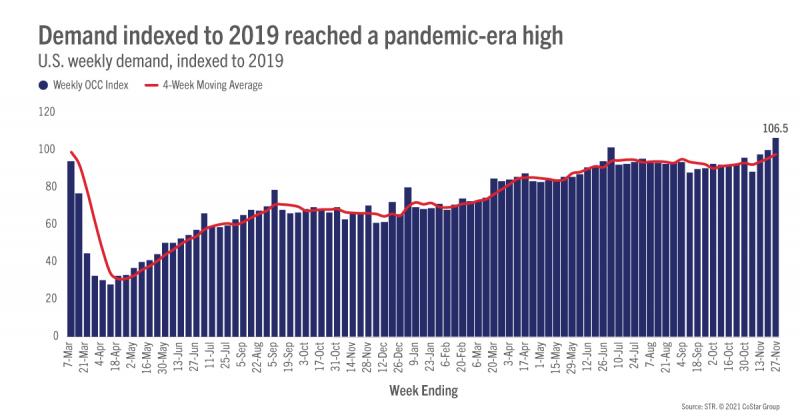
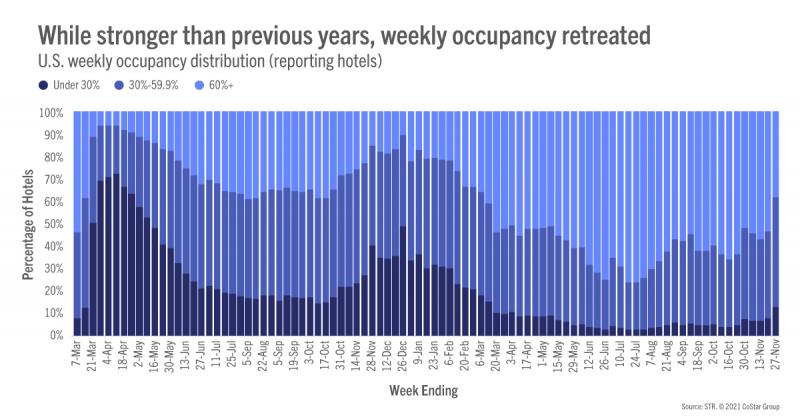
More than 20 million rooms were sold during the week with every day of the week posting a Thanksgiving week record. As compared with Thanksgiving week 2018, the previous record holder, most of the demand gains were seen in upscale and upper midscale hotels, particularly in suburban locations, which makes sense as these hotels are closest to residential areas. Upper upscale hotels saw the largest deficit against 2018, particularly in urban locations. Likewise, independent hotels in urban locations saw a sizeable decrease in demand for the week as compared with 2018. We also noted a decline in demand among resort location hotels across most of the chain scales except upscale and luxury. Overall, demand for the week was at a record high for all locations except urban and resort, although resort location occupancy was the highest (60%) of any location for the week. With the sharp increase in demand, weekly industry occupancy indexed to 2019 increased to 104.6, the highest level since the start of the pandemic. The index has increased in five of the past six weeks with November on track to have the second highest occupancy index of the year, behind only July.
Among STR-defined markets, 39% reported their highest occupancy for a Thanksgiving week. While not its record high, the Florida Keys had this week’s highest occupancy at 80%, which was just shy of the 81% achieved in 2018. Other markets with strong occupancies included Gatlinburg/Pigeon Forge, TN (80%), a record for that market, Hawaii/Kauai Islands (77%), and New York City (72%). New York remained well below its previous high (87%) seen back in 2012 but inched closer to 2018 and 2019 levels (each 83%). The lowest market occupancy for the week was in Wyoming (33%), Madison, WI (34%) and Michigan North (34%). Among the Top 25 Markets, New York had the highest occupancy for the week while Minneapolis reported the lowest (37%). Most of the Top 25 was above 50% occupancy with notable exceptions, including Washington, DC (46%), Chicago (48%), and San Francisco (49%). DC’s occupancy, however, surpassed its 2019 level. Fifteen of the Top 25 Markets had higher occupancy this Thanksgiving week than in 2019.
Average daily rate (ADR) was also at its highest level of any past Thanksgiving week, increasing 1.5% week on week with the index to 2019 soaring to its highest level of the year (114)—meaning that ADR was 14% higher than what it was in 2019. Additionally, the weekly index has been above 100 in four of the past five weeks. Of course, inflation is playing a role in this growth, but when taking it into account, real ADR was also at its highest level of any previous Thanksgiving week with an index at 107—the highest weekly level of the past 100 weeks. On a nominal basis, nearly all markets reported higher ADR this week than in the comparable week of 2019 with the only exceptions being Pennsylvania Area and the New Jersey Shore. Weekly real ADR was above 2019 comparables in 138 of the 166 STR-defined markets with the Florida Keys seeing the highest index at 154. In the Top 25 Markets, 20 markets, including New York City, had real ADR above the comparable 2019 week with San Diego, Miami, and Phoenix reporting ADR 20%+ higher this year than two years ago.
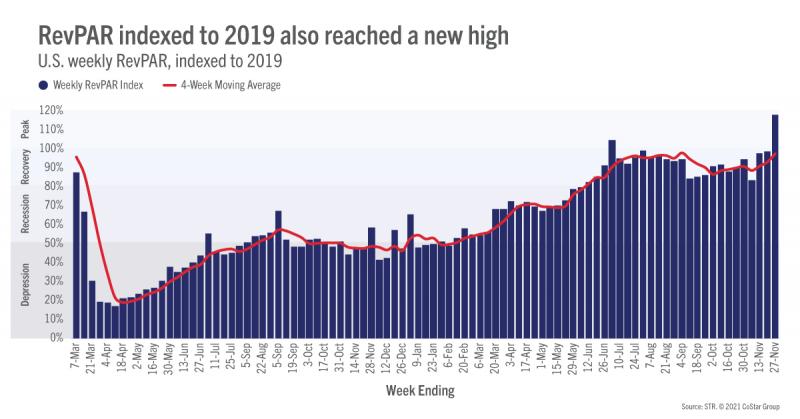
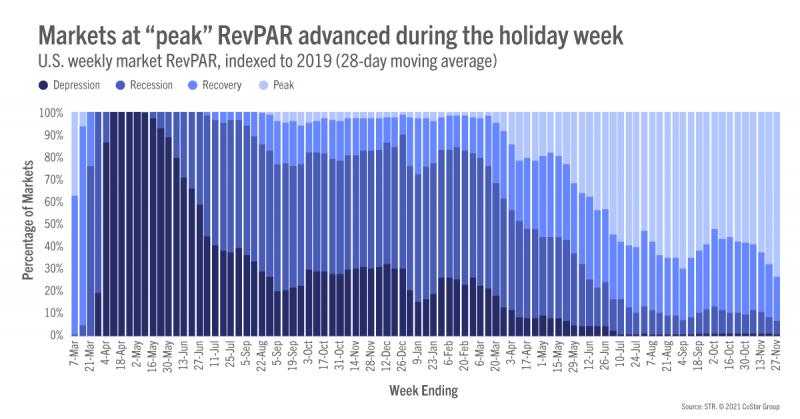
At US$68, revenue per available room (RevPAR) was also at a record high for the Thanksgiving week and 16% higher than in Thanksgiving week 2018, which was the previous record. Likewise, real RevPAR was 6% greater than 2018’s result. RevPAR indexed to 2019 hit 120, the highest weekly outcome of the past 100 weeks and only the third time above 100 during that period. Real RevPAR indexed to 2019 reached 112, also a 100-week high and its second time above 100 since the start of the pandemic. Looking at markets over the past 28 days, 73% were at “peak” RevPAR (RevPAR indexed to 2019 above 100) with 20% in “recovery” (RevPAR indexed to 2019 between 80 and 100).
Outside of the U.S.
Among open hotels, global occupancy increased for a third week to 53%. The U.K. continued to lead the top 10 countries, based on supply, with weekly occupancy at 70%. Mexico is also reporting better occupancy with the week’s level at 62% after posting its highest level since the pandemic three weeks ago (64%). Occupancy in Canada remained stable at 50%, a level it has been at for the past three weeks. Elsewhere, particularly in Germany and Spain, occupancies were beginning to slide downward via new pandemic fears.
With the emergence of the Omicron variant, many non-U.S. markets have seen significant week-over-week declines including Vienna (-69%), Dusseldorf (-33%), Munich (-28%), Frankfurt (-22%), Amsterdam (-17%), and Brussels (-16%). U.K. markets haven’t yet seen an impact, but cancellations are on the rise.
Japan markets saw week-over-week growth amid relaxed restrictions, and the new measures implemented due to Omicron aren’t expected to have a significant impact as hotels had opened only for business travelers (who are still required to quarantine) and were still mostly closed for leisure.
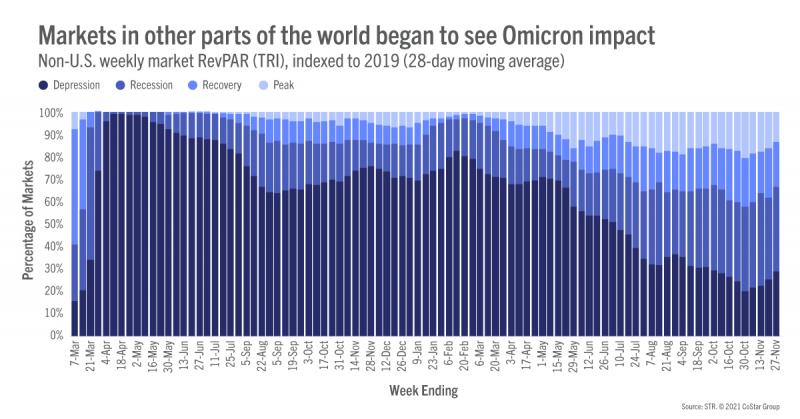
The conditions for many markets outside the U.S. remain rather bleak. In the latest 28-day period, one third of all non-U.S. markets were in “depression” (RevPAR indexed to 2019 below 50), the most of the past eight weeks. Nearly 40% of markets were in “recession” (RevPAR indexed to 2019 between 50 and 80), leaving only a third in “recovery” or “peak,” which is the fewest in those categories since early October.
Big Picture
As many had predicted, this was a very strong week and provided a much-needed confidence boost for the hotel industry. It’s also a reminder not to underestimate the desire/need to be with family and friends during these special holidays after last year’s lockdown. Additionally, the increase in work flexibility along with unused vacation time most likely elongated demand and propelled it to new levels. We believe the same will occur during the Christmas and New Year’s holidays unless the new COVID variant is found to be more deadly or dangerous than its predecessors. Barring that, the end of the year should be rather strong and unlike any other end seen before it.
To learn more about the data behind this article and what STR has to offer, visit https://str.com/.


Sign up to receive our stories in your inbox.
Data is changing the speed of business. Investors, Corporations, and Governments are buying new, differentiated data to gain visibility make better decisions. Don't fall behind. Let us help.


Sign up to receive our stories in your inbox.
Data is changing the speed of business. Investors, Corporations, and Governments are buying new, differentiated data to gain visibility make better decisions. Don't fall behind. Let us help.


