Source: https://www.attomdata.com/news/market-trends/flipping/attom-q3-2021-u-s-home-flipping-report/
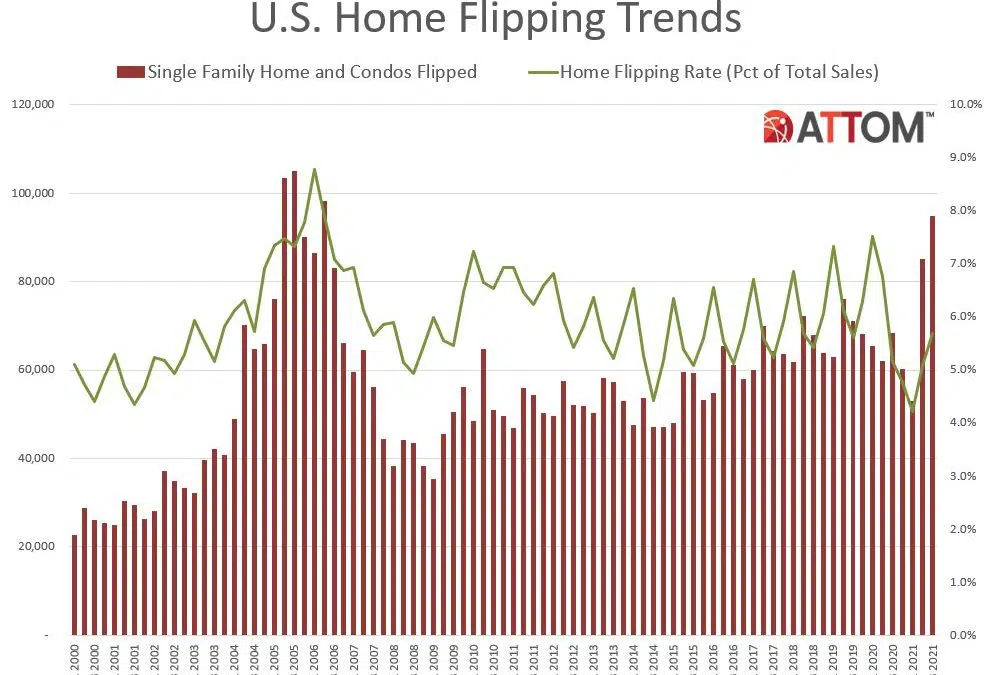
ATTOM, curator of the nation’s premier property database, today released its third-quarter 2021 U.S. Home Flipping Report showing that 94,766 single-family houses and condominiums in the United States were flipped in the third quarter. Those transactions represented 5.7 percent of all home sales in the third quarter of 2021, or one in 18 transactions, a figure that was up for the second quarter in a row after a year of declines. The latest total marked an increase from 5.1 percent, or one in every 20 home sales in the nation, during the second quarter of 2021, and from 5.2 percent, or, or one in 19 sales, in the third quarter of last year.
But the report also shows that typical raw profits remained below where they were a year ago and, more importantly, profit margins dipped to their lowest point since early 2011.
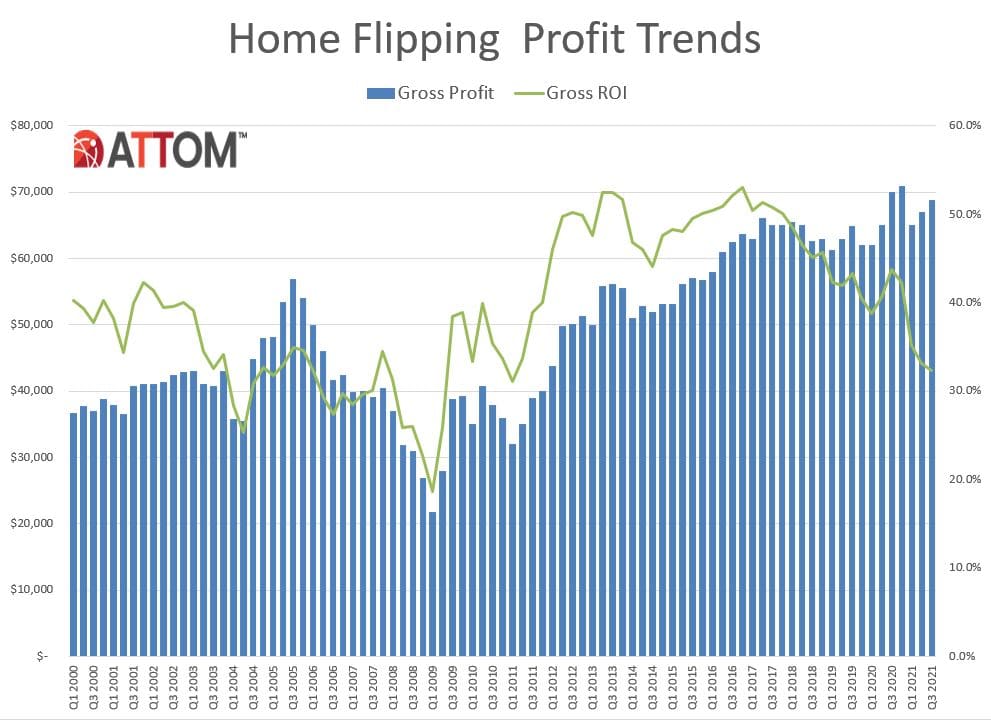
Among all flips nationwide, the gross profit on typical transactions (the difference between the median sales price and the median paid by investors) stood at $68,847 in the third quarter of 2021. While that was up 2.7 percent from $67,008 in the second quarter of 2021, it was 1.6 percent less than the $70,000 level recorded in the third quarter of 2020.
Profit margins, meanwhile went down for the fourth quarter in a row, as the typical gross-flipping profit of $68,847 in the third quarter of 2021 translated into just a 32.3 percent return on investment compared to the original acquisition price. The national gross-flipping ROI was down from 33.2 percent in the second quarter of 2021 and from 43.8 percent a year earlier, to its lowest point since the first quarter of 2011.
The decrease in the typical profit margin from the third quarter of last year to the same period this year was the largest annual drop since early in 2009, when the housing market was crashing from the effects of the Great Recession.
Profit margins declined in the third quarter of 2021 as prices on flipped homes continued to rise more slowly than they did when investors originally bought their properties.
Specifically, the median price of homes flipped in the third quarter of 2021 shot up to another all-time high of $281,847. That was up 4.8 percent from $269,000 in the second quarter of 2021 and 22.5 percent from $230,000 a year earlier. The annual increase stood out as the largest for flipped properties since 2005 while the quarterly gain was the second biggest since 2015.
But the latest resale price run-ups again failed to surpass increases that investors were absorbing – 5.4 percent quarterly and 33.1 percent annually – when they bought the homes that were sold in the third quarter of this year. That gap – prices rising less on resale than on purchase – led to profit margins dropping again.
The price surges on both sides of flipping deals came as the decade-long housing-market boom in the United States continued throughout the nation during the third quarter of 2021. Prices kept spiking as a glut of buyers largely unscathed by the Coronavirus pandemic continued chasing an already tight supply of homes. Buyers have flooded the market since the pandemic hit early in 2020, drawn in large part by 30-year home-mortgage rates that dipped below 3 percent and a desire among many to escape virus-prone areas and get space for developing work-at-home lifestyles.
“Home flipping produced another round of competing trends in the third quarter of this year as more investors got in on the action but got less out of it,” said Todd Teta, chief product officer at ATTOM. “It’s clear that declining fortunes weren’t enough to repel investors amid a typical scenario of 32 percent profits before expenses on deals that usually take an average of five months to complete. We will see over the coming months whether the amount they can make on these quick turnarounds will still be enough to keep luring them into the home-flipping business or start pushing them elsewhere.”
Home flipping rates up in three-quarters of local markets
Home flips as a portion of all home sales increased from the second quarter of 2021 to the third quarter of 2021 in 142 of the 195 metropolitan statistical areas analyzed in the report (73 percent). While rates commonly rose by less than one percent across the country, they reached levels that generally reflected percentages seen throughout most of the past decade. (Metro areas were included if they had a population of 200,000 or more and at least 50 home flips in the third quarter of 2021.)
Among those metro areas, the largest flipping rates during the third quarter of 2021 were in Ogden, UT (flips comprised 9.5 percent of all home sales); Phoenix, AZ (9.5 percent); Salisbury, MD (9.3 percent); Salt Lake City, UT (9.3 percent) and Laredo, TX (9.2 percent).
Aside from Phoenix and Salt Lake City, the highest flipping rates during the third quarter of 2021 in 53 metro areas with a population of 1 million or more were in Memphis, TN (9 percent); Oklahoma City, OK (8.8 percent) and Austin, TX (8.5 percent).
The smallest home-flipping rates in the third quarter were in Honolulu, HI (0.8 percent); Portland, OR (2.5 percent); Rochester, NY (2.5 percent); Manchester, NH (2.7 percent) and Santa Rosa, CA (2.7 percent).
Typical home flipping returns decrease in half of markets
The median $281,847 resale price of homes flipped nationwide in the third quarter of 2021 generated a gross flipping profit of $68,847 above the median investor purchase price of $213,000. That resulted in a 32.3 percent profit margin.
Profit margins dipped from the second quarter of 2021 to the third quarter of 2021 in 92 of the 195 metro areas with enough data to analyze (47 percent).
The biggest declines came in Fargo, ND (ROI down from 196.5 percent in the second quarter of 2021 to 107.2 percent in the third quarter of 2021); Trenton, NJ (down from 117.6 percent to 45 percent); Oklahoma City, OK (down from 192.1 percent to 127.6 percent); Omaha, NE (down from 143.3 percent to 95.3 percent) and Macon, GA (down from 79.5 percent to 33.5 percent).
Markets with the largest returns on investment during the third quarter of 2021 on typical home flips were Buffalo, NY (ROI of 130.6 percent); Oklahoma City, OK (127.6 percent); Florence, SC (125.8 percent); Pittsburgh, PA (124.6 percent) and Scranton, PA (123.2 percent).
Aside from Buffalo, Oklahoma City and Pittsburgh, the largest investment returns in the third quarter among metro areas with a population of at least 1 million were in Baltimore, MD (90.6 percent) and Philadelphia, PA (88.7 percent).
Metro areas with the smallest profit margins on typical home flips in the third quarter of 2021 were Laredo, TX (7.5 percent return); Boise, ID (8 percent); Gulfport, MS (8.4 percent); Lubbock, TX (10 percent) and Portland, OR (10.1 percent).
Raw profits still highest in the West and Northeast; lowest in the Midwest and South
The highest raw profits on median-priced home flips in the third quarter of 2021, measured in dollars, were again concentrated among western and southern metro areas. Among metros with enough data to analyze, nine of the top 10 were in the West and Northeast, led by San Jose, CA (typical gross profit of $213,000); Honolulu, HI ($176,070); Fargo, ND ($166,458); Salisbury, MD ($145,000); and Baltimore, MD ($145,000).
At the opposite end of the range, 23 of the 25 lowest raw profits on typical deals were spread across the South and Midwest. The smallest were in Gulfport, MS ($14,579 profit); Laredo, TX ($15,281); Beaumont, TX ($16,850); Lubbock, TX ($17,725) and Huntington, WV-Ashland, KY ($18,400).
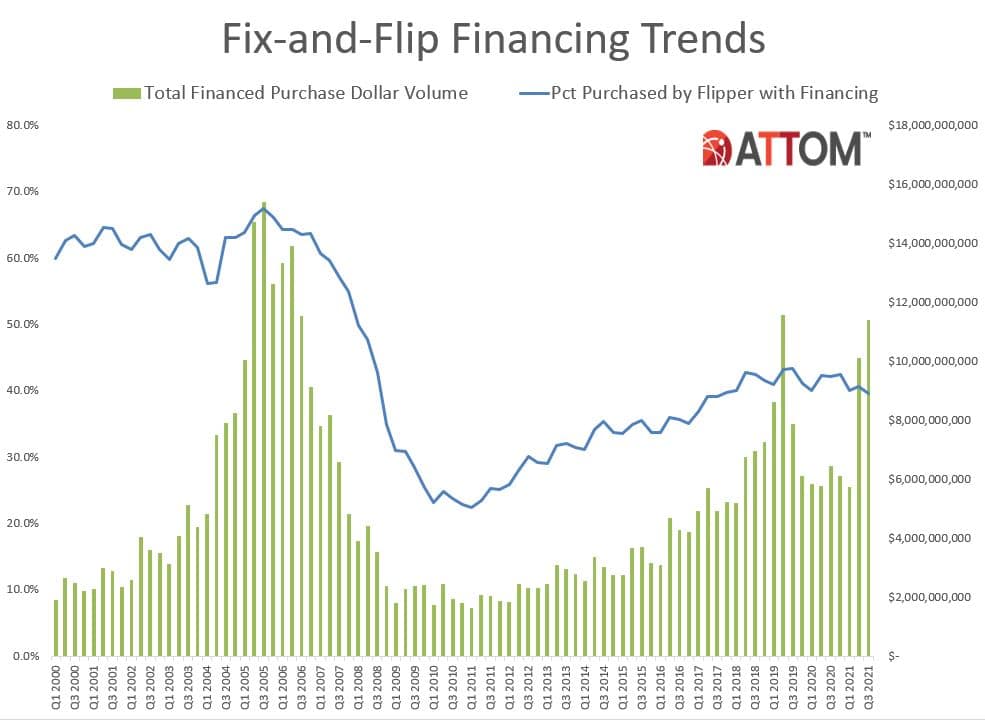
Home flips purchased with cash up slightly
Nationally, the portion of homes flipped in the third quarter of 2021 that had been purchased with cash by investors increased to 60.4 percent, up from 59.4 percent in the second quarter of 2021, and up from 57.7 percent in the third quarter of 2020. Meanwhile, 39.6 percent of homes flipped in the third quarter of 2021 had been bought with financing. That was down from 40.6 percent in the prior quarter, and down from 42.3 percent a year earlier.
Among metropolitan areas with a population of 1 million or more and sufficient data to analyze, those with the highest percentage of flips in the third quarter of 2021 that had been purchased with cash by investors were in Buffalo, NY (86.1 percent); Cleveland, OH (82 percent); Pittsburgh, PA (82 percent); Detroit, MI (81.9 percent) and Cincinnati, OH (80.1 percent)
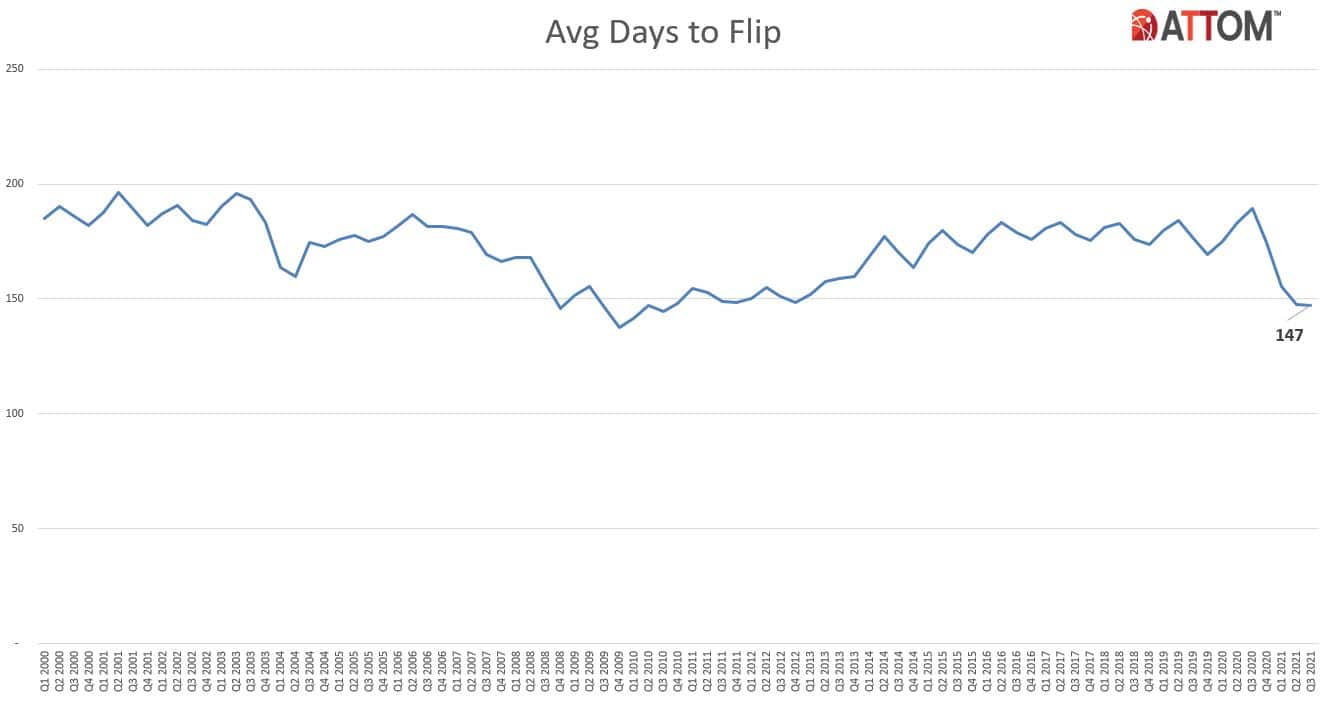
Average time to flip nationwide at shortest level since 2010
Home flippers who sold properties in the third quarter of 2021 took an average of 147 days to complete the transactions, the smallest turnaround time since the third quarter of 2010. The latest number was down from an average of 148 in the second quarter of 2021 and 189 in the third quarter of 2020.
FHA buyers continue to purchase historically low portion of flipped homes
Of the 94,766 U.S. homes flipped in the third quarter of 2021, only 7.8 percent were sold to buyers using loans backed by the Federal Housing Administration (FHA), up slightly from 7.6 percent in the prior quarter but down from 13.7 percent in the third quarter of 2020. That latest figure marked the second lowest portion since the fourth quarter of 2007.
Among the 195 metro areas with a population of at least 200,000 and at least 50 home flips in the third quarter of 2021, those with the highest percentage of flipped properties sold to FHA buyers — typically first-time home buyers — were Hagerstown, MD (23.5 percent); Laredo, TX (22 percent); Reading, PA (20.2 percent); Allentown, PA (20 percent) and Yuma, AZ (19.7 percent).
Only 64 counties have home-flipping rate of at least 10 percent
Home flips accounted for more than 10 percent of all home sales in just 64 of the 1,123 counties around the U.S. with at least 10 home flips in the third quarter of 2021. They were led by Camden County, NC (south of Norfolk, VA) (15.9 percent); Lumpkin County, GA (north of Atlanta) (15.1 percent); Logan County, KY (outside Bowling Green) (14.7 percent); Canadian County, OK (outside Oklahoma City) (14.4 percent) and Adams County, OH (east of Cincinnati) (13.4 percent).
To learn more about the data behind this article and what Attom Data Solutions has to offer, visit https://www.attomdata.com/.


Sign up to receive our stories in your inbox.
Data is changing the speed of business. Investors, Corporations, and Governments are buying new, differentiated data to gain visibility make better decisions. Don't fall behind. Let us help.


Sign up to receive our stories in your inbox.
Data is changing the speed of business. Investors, Corporations, and Governments are buying new, differentiated data to gain visibility make better decisions. Don't fall behind. Let us help.