As we come to the end of another year of social distancing, we’re using today’s tracker to share some insights on Black Friday, how the holiday season is faring so far, and what malls can tell us about larger trends and shopper hesitancy.
We’re also sharing our recommendations for marketers on how to respond to ongoing shifts and sentiment due to omicron. Comparing the changes social distancing brought to holiday shopping in 2020 vs 2021, one thing is clear: Black Friday had brands rebounding in a big way. Let’s take a look below.
Black Friday Capped a Strong November
Last year, we began November as case counts ramped up their winter surge. Not knowing what was in store, people hit the shops earlier. Black Friday 2020 was a spike, but the majority of shopping demand was preemptively spread across November. The usual stalwarts of Black Friday – electronics stores, department stores – felt the crush most, as their traffic was ~50% off its normal levels. But the earlier traffic in November saved them and their monthly total was ~80% of 2019’s total.
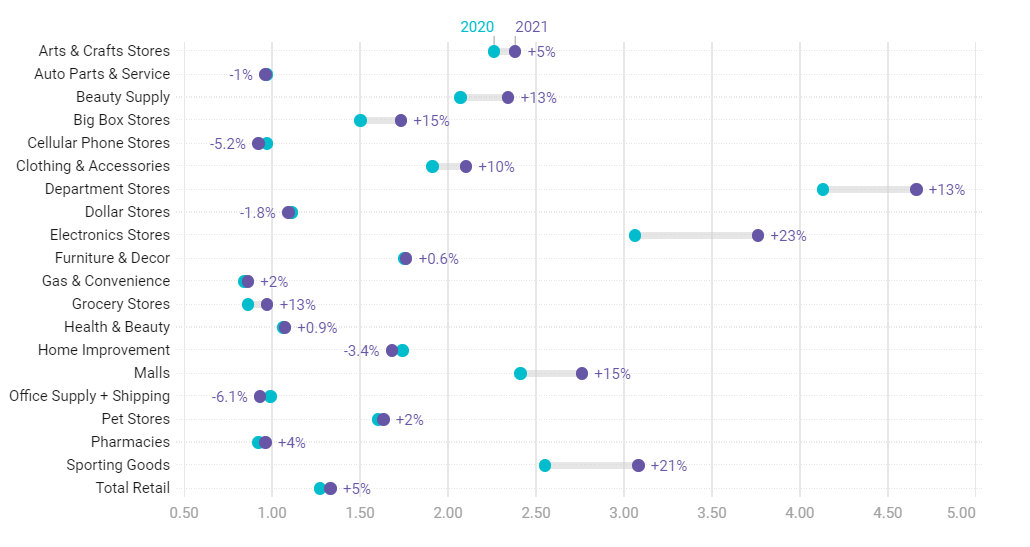
In 2021, however, the stalwarts of Black Friday bounced back, big time. The largest gains compared to 2020 were from electronics stores (+23%), sporting good stores (+21%), malls (+15%), and department stores (+13%):
2021’s Black Friday Outperformed 2020 in Most Categories
Black Friday retail foot traffic volumes were higher in 2021 than 2020, and the ‘pop’ off each category’s recent baseline was flat or up. Discretionary retail categories such as Department Stores, Electronics, Malls, and Sporting Goods saw the biggest pops while essentials were flat or below the recent baseline.

We use a metric called ‘boost’ to evaluate Black Friday performance. Rather than comparing foot traffic to the same day in the previous year, we calculate the average Friday traffic volumes for all of October and use that as our baseline. A score of 2.00 means that a store or sector saw twice as much traffic as they usually saw on Fridays in October.
Our ‘boost’ metric tells us that Black Friday was a success: it spurred a surge of traffic, across nearly all verticals. Electronics stores saw nearly 4x their October norm, big box earned a healthy 75% gain, and traffic to shopping malls was ~2.75x times higher than usual.
‘Boost’ helps us understand how much traffic Black Friday itself spurred, but it doesn’t help tell us much about the overall health of the overall holiday season. As we saw last year, it’s possible to have a weak Black Friday but a decent November. How are we doing overall this year?
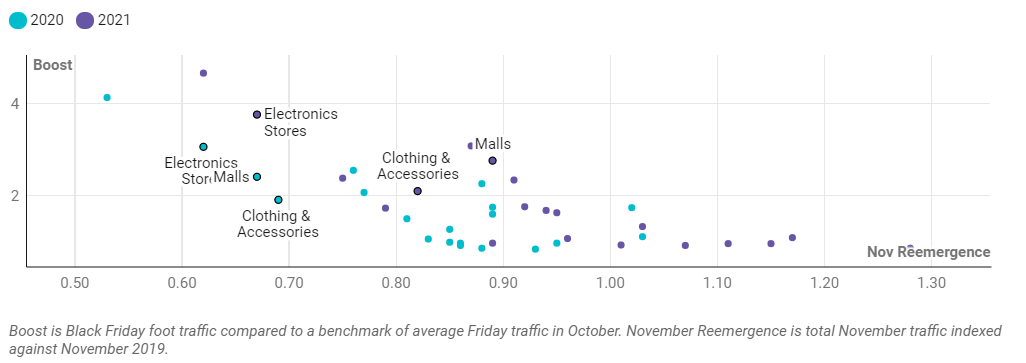
We’re doing pretty good! To measure the health of our overall November traffic we turn to our usual year-over-year Reemergence metric. Though remember: Reemergence compares traffic to the same day in 2019, not 2020. Let’s look at our Black Friday boost compared to our November Reemergence:
Similar Black Friday Boost, and Higher Reemergence than 2020
Traffic across all of November was sustained and significantly higher than 2020’s malaise.

Our boost is slightly up (as we saw in the first chart) but our Reemergence is significantly shifted to the right. At first glance, you might mistakenly assume that the purple dots right next to blue dots represent the same categories. They don’t (with the notable exception of grocery stores); hover over the chart and you can see it’s not slight moves to the right but very significant ones. Dollar stores, for example, are up 14 basis points.
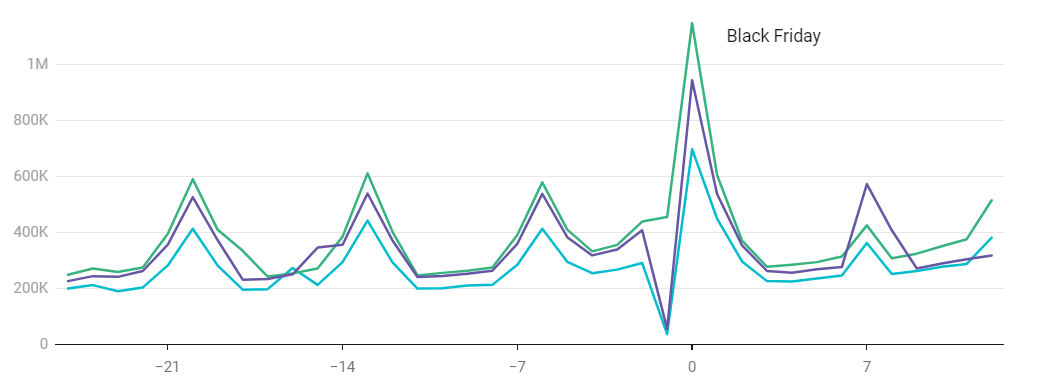
Let’s dig deeper and peer under the indexes and look at the actual traffic for malls:
Daily Foot Traffic to Shopping Malls
2021 foot traffic to malls is just shy of its 2019 levels, with the notable exception of barely any traffic on Thanksgiving day.

It’s amazing to see that 2021’s mall foot traffic levels are within spitting distance of 2019’s volume. The 2020 habit of shopping early and often continued this year, spurred as much by supply chain issues as an upswing in case counts. But the big difference, as we noted last year, is Thanksgiving day.
After nearly a decade of sales creeping closer and closer to Thanksgiving, even overlapping with the midday dinner itself in recent years, COVID has all but established a truce. Stores are mostly closed on Thanksgiving and/or the doorbusters are kept to Friday.
Rising Case Counts vs. Our Collective Fatigue
What caught our eye about the chart above is that last datapoint from 2021. While the last two years tipped upward, this year remains flat. It’s just one datapoint, so we’ll have to wait if the trend it hints at is real. Did people stocking up in advance frontload holiday demand, resulting in a weak December? Or is Omicron generating some hesitancy?
We reviewed our predictions for Omicron two weeks ago: we believe traffic will stop growing, but remain stable so long as hospitalizations don’t increase dramatically. With two more weeks of data, our expectation remains the same. Omicron appears significantly more transmissive, which likely results in a wave of cases across the country. But the hesitancy generated by this wave is up against an increasing amount of COVID fatigue.
A Monmouth poll released this week details our weariness. 6 in 10 Americans say they’re “worn out” due to changes they’ve had to make due to COVID. Most people still support masking and/or social distancing measures (55%), but that support is down from its September levels (63%). In July, when staring down Delta, 18% of those surveyed said they were “very concerned” with catching a variant. In December only 14% are “very concerned.” Weariness saps our energy for caution, even as cases rise. It’s likely we’ll make and maintain some changes (masks on indoors), but lack the appetite for others (indoor dining closures).
Even though we’re updating our model, our recommendation for marketers remains unchanged: “By limiting your targeting to audiences with higher risk tolerances, who continue to be active, you can tune your campaign to those people you know will continue to shop, dine out, or travel…given the current conditions on the ground. Capture the customers who are already venturing out. If you must cut back, do so by not targeting those who chose to remain home.”
To learn more about the data behind this article and what PlaceIQ has to offer, visit https://www.placeiq.com/.


Sign up to receive our stories in your inbox.
Data is changing the speed of business. Investors, Corporations, and Governments are buying new, differentiated data to gain visibility make better decisions. Don't fall behind. Let us help.


Sign up to receive our stories in your inbox.
Data is changing the speed of business. Investors, Corporations, and Governments are buying new, differentiated data to gain visibility make better decisions. Don't fall behind. Let us help.


