
Introduction
Welcome to the first Apartment List National Rent Report of 2022. Our national index fell by 0.2 percent during the month of December, marking the only time in 2021 when rents declined month-over-month. A slight dip in rents at this time of year is typical of seasonality in the market, but it’s especially notable after a year of record-setting growth. Over the course of calendar year 2021, the national median rent increased by a staggering 17.8 percent. To put that in context, annual rent growth averaged just 2.3 percent in the pre-pandemic years from 2017-2019.
61 of the nation’s 100 largest cities saw rents fall this month, indicating a widespread rental market cooldown. In particular, Seattle and San Francisco both landed in the top five for largest month-over-month declines, signalling that these pricey tech hubs may be entering a second phase of COVID-related rental market softness. More broadly, our national vacancy index ticked up again for the fourth straight month, as we enter 2022 amid an easing of the tight market conditions that characterized 2021.
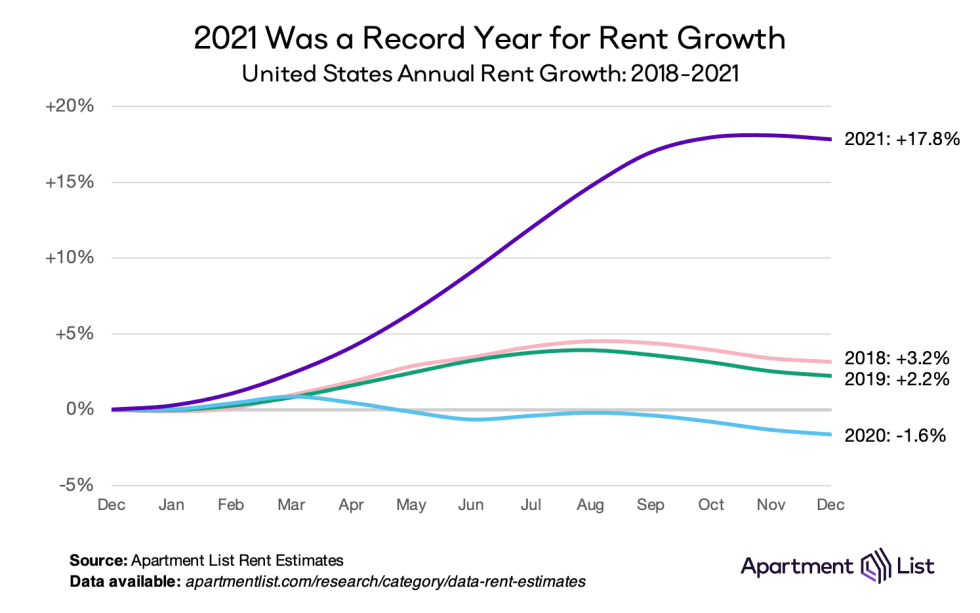
Rents spiked by a record-setting 18% in 2021
Over the course of 2021 as a whole, rent prices spiked an unprecedented 17.8 percent nationally. While the early stages of the pandemic led to a modest decline in rents in 2020 (-1.6%), the staggering growth of 2021 more than made up for the lost ground. In fact, the national median rent ($1,309) is now $119 greater than where we project it would have been if rent growth since the start of the pandemic had been in line with the average growth rates we saw in 2018 and 2019. Rent growth in 2021 far outpaced that of any prior year in our estimates, which go back to 2017. Over those five years, 2018 had the second fastest growth, with an increase of 3.2 percent; growth in 2021 was more than five times that rate.
But 2022 is starting amid a cooldown
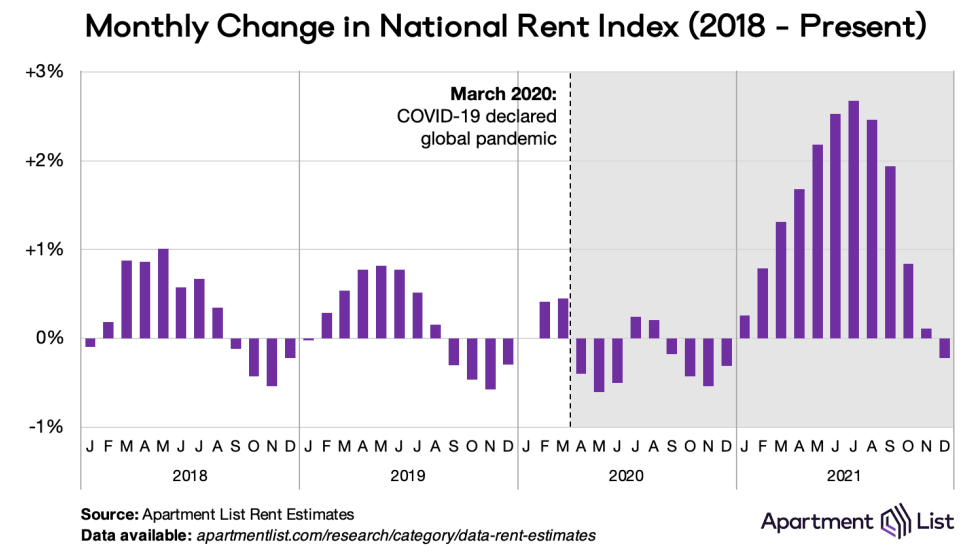
Although many renters may be rightfully dismayed by last year’s record-setting rent growth, the new year is bringing with it a bit of relief. Our national rent index actually fell by 0.2 percent in December, making it the only month of 2021 in which rents declined. December also marked the fifth straight month in which monthly rent growth has slowed after peaking at 2.7 percent in July. A slowdown during the fall and winter is typical due to seasonality in this market, but the current slowdown is capping a year that has been characterized by unprecedented price increases. For seven months from March through September, month-over-month rent growth exceeded the pre-pandemic record going back to 2017. In December, however, rent growth fell in line with pre-pandemic trends – rents also fell by 0.3 percent in December 2019, and by 0.2% in December 2018.
NYC had the nation’s fastest rent growth in 2021
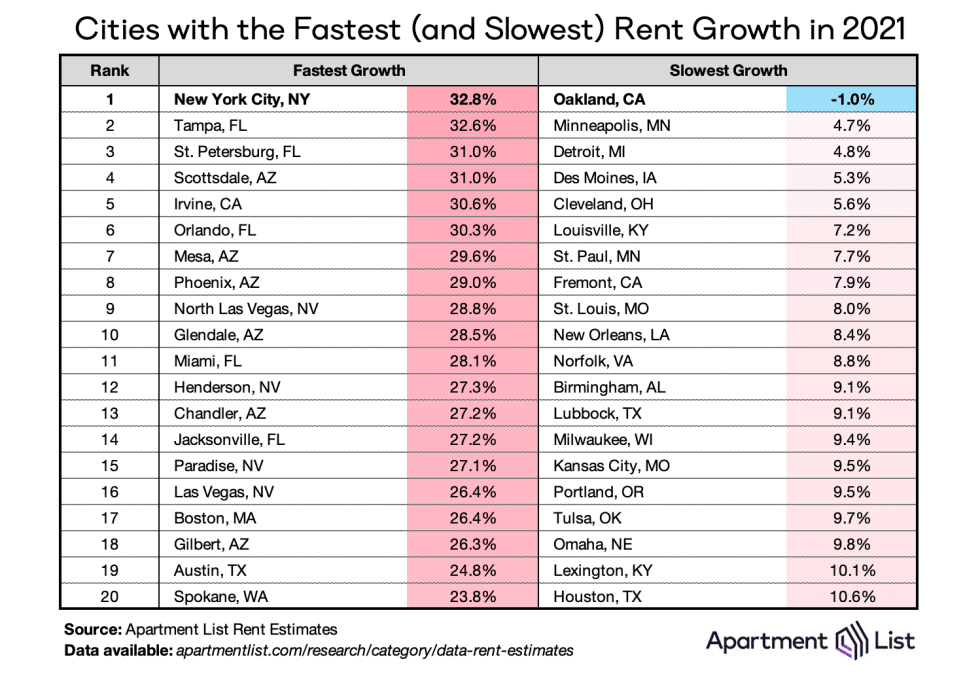
The nation’s largest city is also the place where rent prices grew the fastest in 2021. In New York City, the median price for an apartment increased from $1,573 one year ago to $2,089 today, a massive jump of 32.8%. NYC narrowly edged out a number of smaller but rapidly-growing cities that absorbed significant rental demand throughout the pandemic, like Tampa, FL (+33.6%) and Phoenix, AZ (+29.0%). Below are the 20 cities that saw the fastest (and slowest) rent growth throughout 2021.
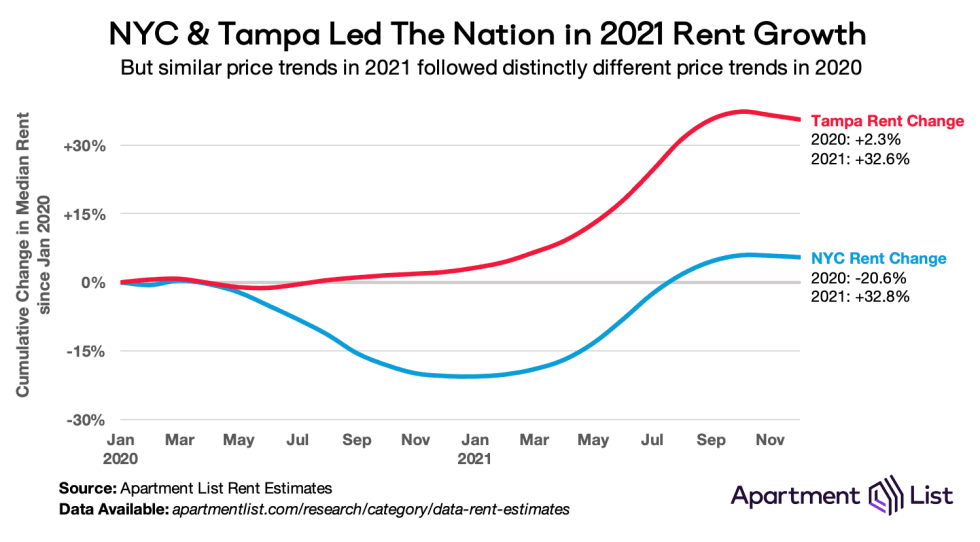
What differentiates New York City from most other cities at the top of this list is the local market conditions going into 2021. The apartment market in Tampa FL, for example, experienced only a brief setback from the pandemic. There, prices rebounded quickly in the second half of 2020 and that growth continued throughout 2021. But in New York City, 2020 was characterized by deep price cuts as demand shifted away from dense urban centers for several months. While 2021 increases in Tampa were pushing prices to never-before-seen highs, 2021 increases in New York were largely making up for losses experienced the year before.
On the other end of the spectrum, Oakland CA is the only major American city that saw prices fall in 2021, with a meager 1% dip. The nearby city of Fremont also finds itself on the list, alongside a number of midwestern and Texas markets. However, it’s worth noting that while these rent changes appear modest in 2021, they represent major price increases compared to previous years. In 2019, only 18 of the nation’s 100 largest cities saw rent prices increase more than 5%. In 2021, this happened in 99 of the 100 largest – all but Oakland.
Rents fell month-over-month in 61 of 100 largest cities
If 2020 was characterized by price convergence (expensive cities getting cheaper and cheaper cities getting more expensive), 2021 was characterized by price inflation: cities large and small getting more expensive, rapidly. This can be seen in the chart below, which visualizes monthly rent changes in each of the nation’s 100 largest cities from January 2018 to present. The color in each cell represents the extent to which prices went up (red) or down (blue) in a given city in a given month. The band of dark red in 2021 depicts this year’s massive rent boom, which peaked in July and August 2021 when all 100 cities in this chart saw prices go up. As we closed out the year, the three rightmost columns show that the recent cooldown in rents is also geographically widespread. In December, prices fell in 61 of the nation’s 100 largest cities.
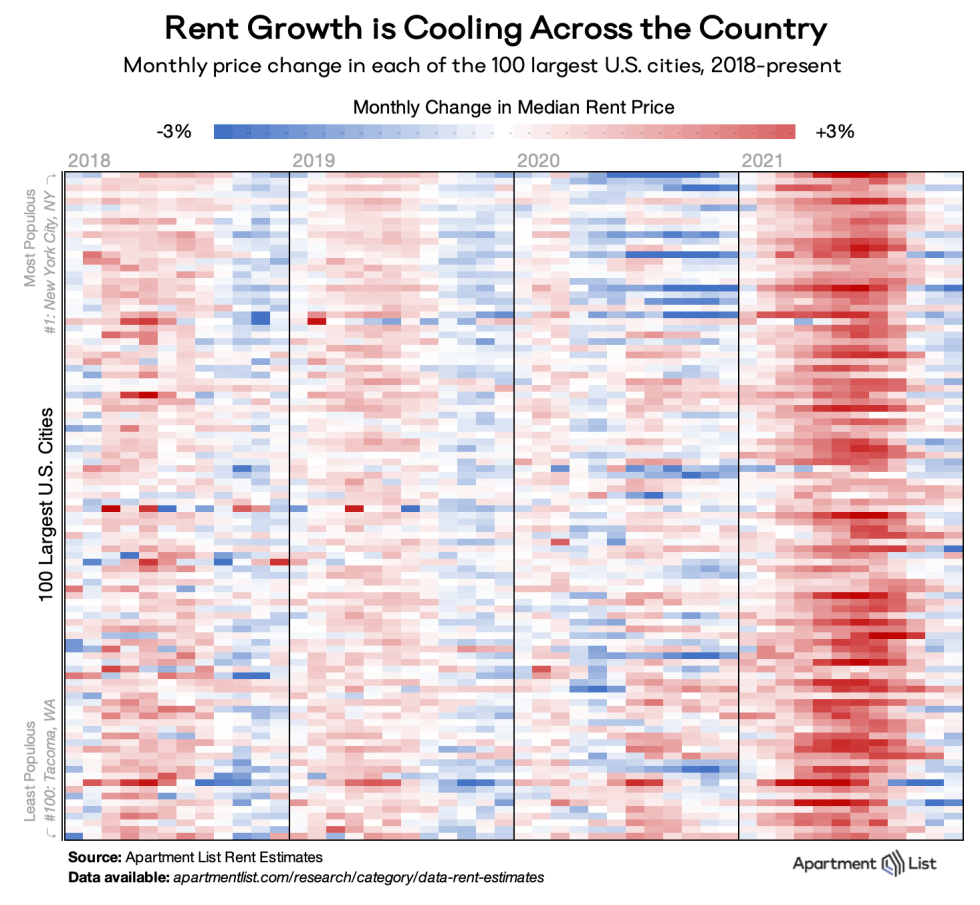
Steady rent declines have occurred in a wide variety of places. Prices have dropped for three consecutive months in some of the smaller cities that saw massive influxes of new residents throughout the pandemic, including Boise ID, Fresno CA, and Reno NV. But similar price drops have also taken place in larger urban centers like Boston MA, San Francisco CA, and Chicago, IL. Meanwhile, rent increases have persisted in warm-weather cities across the Sun Belt, like Orlando FL, Tucson AZ, and Dallas TX. Here, rent growth decelerated but remained positive throughout the last several months of 2021.
Vacancy index shows rental market tightness continuing to ease
As we’ve explored in detail, much of the 2021 rent boom was attributed to a tight market in which more households are competing for fewer vacant units. Our vacancy index spiked to 7 percent last April, as many Americans moved in with family or friends amid the uncertainty and economic disruption of the pandemic’s onset. After that, however, vacancies began a steady decline, eventually falling below 4 percent.
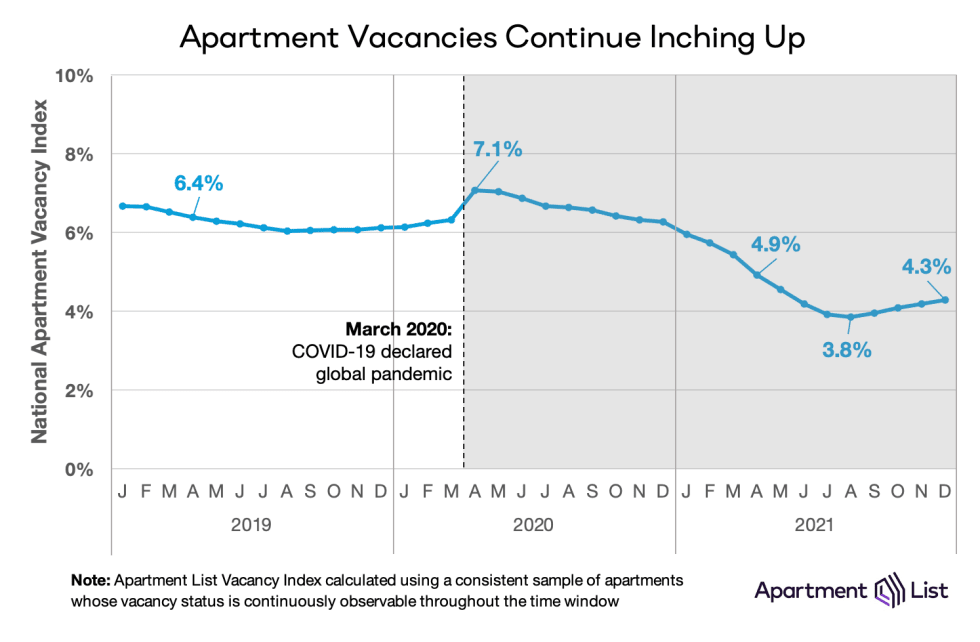
After bottoming out at 3.8 percent in August 2021, our vacancy index has ticked up slightly for four consecutive months and stands at 4.3 percent at the end of the year. Although the recent vacancy increase has been modest and gradual, it represents an important inflection point, signalling that tightness in the rental market is finally beginning to ease. If our vacancy rate continues this trend in the coming months, it’s likely that rent growth will also continue to cool.
Conclusion
After a year of astronomical price increases, December 2021 finally brought some relief to the rental market. Our national rent index spiked nearly 18 percent in 2021 but fell 0.2 percent in December, a modest dip but the first such decline observed in over a year. While the apartment market remains tight – the national vacancy rate sits just above 4 percent compared to 6 percent pre-pandemic – the winter season continues to bring signs that pressure is gradually beginning to ease. That said, it’s important to bear in mind just how much affordability has dissipated in 2021. 99 of the nation’s 100 largest cities saw rents jump more than 10 percent over the year, and the national median apartment cost eclipsed $1,300 for the first time ever. So despite a recent cool-down, many American renters will remain burdened throughout 2022 by historically high housing costs.
To learn more about the data behind this article and what Apartment List has to offer, visit https://www.apartmentlist.com/.


Sign up to receive our stories in your inbox.
Data is changing the speed of business. Investors, Corporations, and Governments are buying new, differentiated data to gain visibility make better decisions. Don't fall behind. Let us help.


Sign up to receive our stories in your inbox.
Data is changing the speed of business. Investors, Corporations, and Governments are buying new, differentiated data to gain visibility make better decisions. Don't fall behind. Let us help.