
Throughout the Leisure & Recreation Industry, entertainment businesses in both the US and UK have been seeing a strong start to 2022. Whether it’s hours-long lines for a popcorn bucket at a theme park or a Spidey-driven boost to the box office, growth seems extremely positive versus last year. But how quickly we forget – how does this growth stack up when compared to two years ago? In today’s Insight Flash, we use the unique set of tools Consumer Edge provides to look at two-year growth rates of Leisure & Recreation businesses on both sides of the Atlantic – focusing on which subindustries and companies have shown recent strength versus pre-pandemic spend.
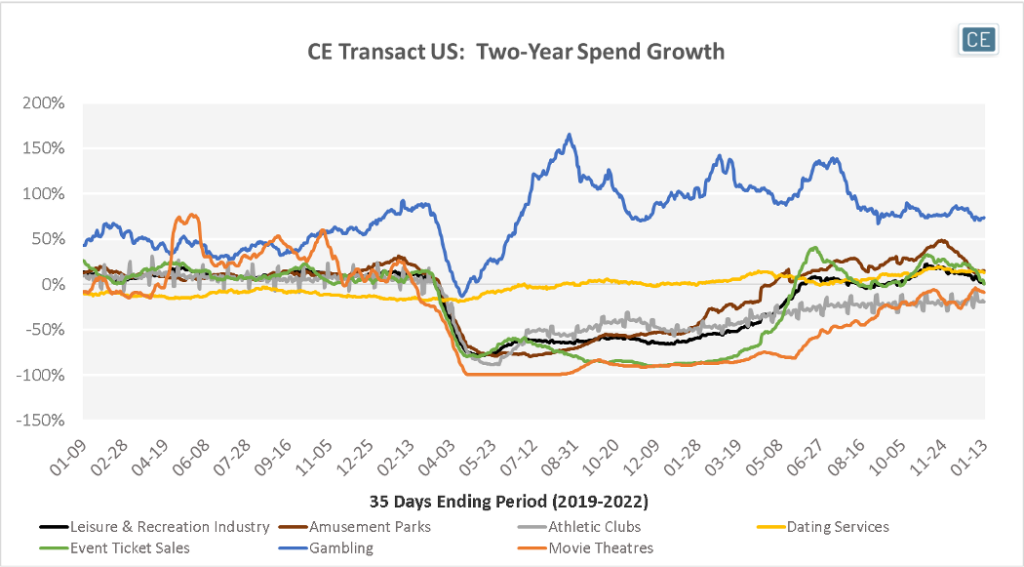
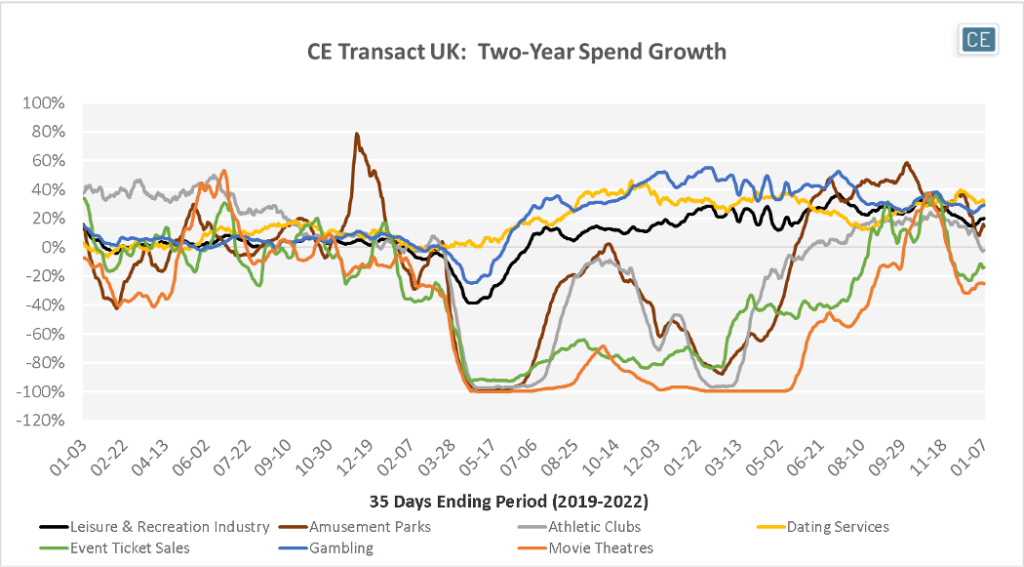
In the UK and even more in the US, Gambling stands out as having particularly strong growth on a two-year basis. The availability of online options caused a surge in growth in both geographies as early as Spring 2020, with only minor moderation since then. In the last 35 days of data in the UK (through 1/7/22), Gambling spend on credit and debit cards grew almost 30% versus two years prior. In the last 35 days of data in the US (through 1/13/22) it grew almost 75%, despite recent changes in FanDuel’s acceptance of payment cards. In the UK, two-year spend growth on direct payments (not through apps) to Dating Services came out slightly higher at just over 30%. In the US, spend growth didn’t come nearly as close in other subindustries, with Amusement Parks and Dating Services both growing just below 15% on a two-year basis. In the US, Event Ticket sales growth had been strong at around 20% two-year spend growth for much of the fall through December, but has fallen dramatically in the last few weeks, potentially due to Omicron fears. A similar slowdown started much earlier in the UK.
Rolling 35-Day Subindustry Spend Growth
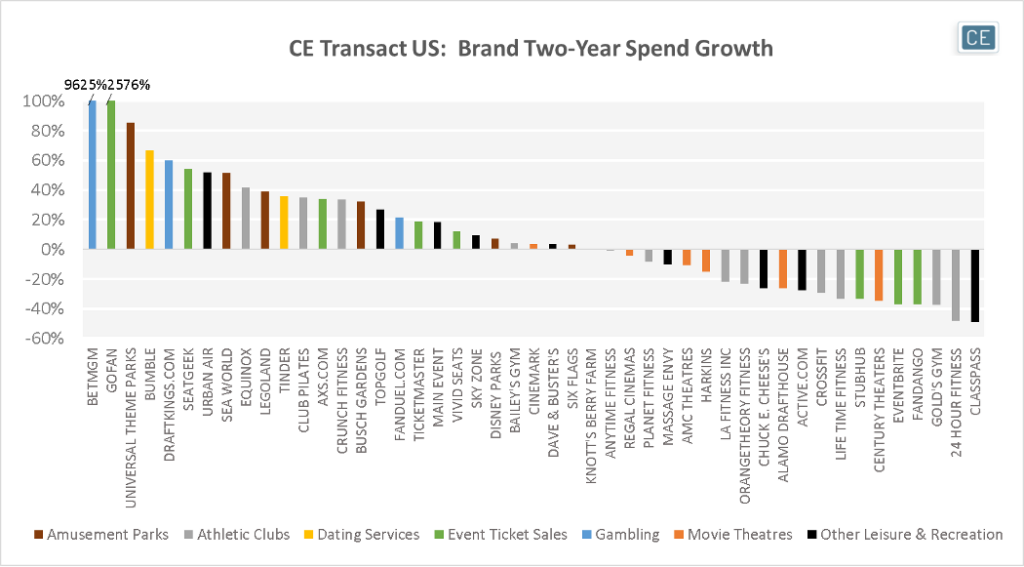
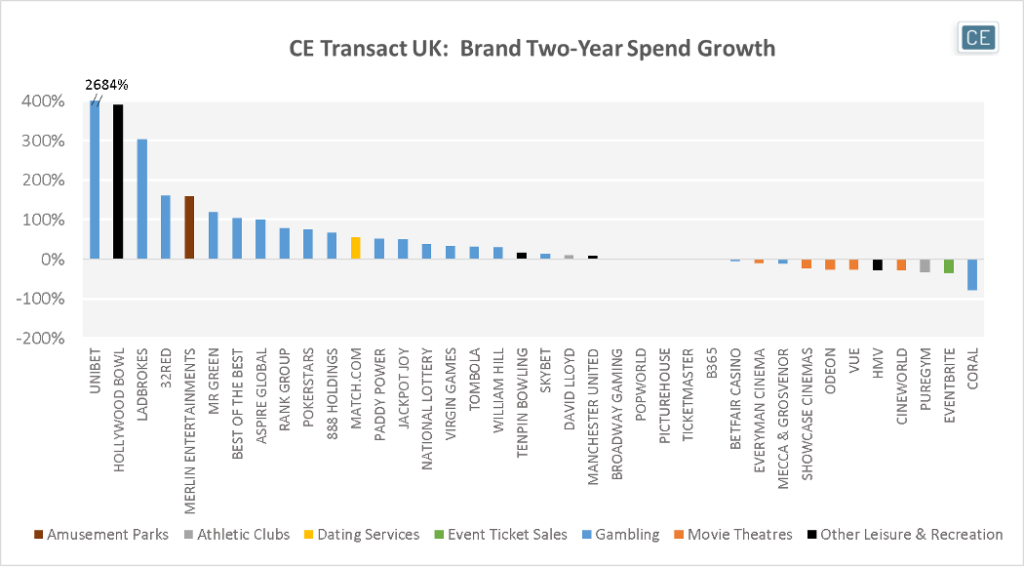
As in all industries, Leisure & Recreation has its winners and losers across subindustries. Although Gambling showed the highest two-year growth as a subindustry in the US, ticket site GoFan saw explosive spend growth over 2,000% versus two years prior and SeatGeek grew more than 50%. Payments directly to Bumble and Tinder on credit and debit cards (not counting app stores) were also in the top growth cohort. Several Athletic Clubs also saw positive growth despite negative trends for the subindustry. Though Cinemark was the only tracked Movie Theatre in the US with positive two-year growth in the last 35 days, despite a wave of Christmas movie releases. In the UK, positive two-year growth was much more skewed towards Gambling. However, Hollywood Bowl saw spend several times that of two years ago, as did Merlin Entertainment. Match.com, Tenpin Bowling, and David Lloyd Clubs also all grew double digits in the last 35 days versus the two years ago period.
Last 35 Days Brand Growth
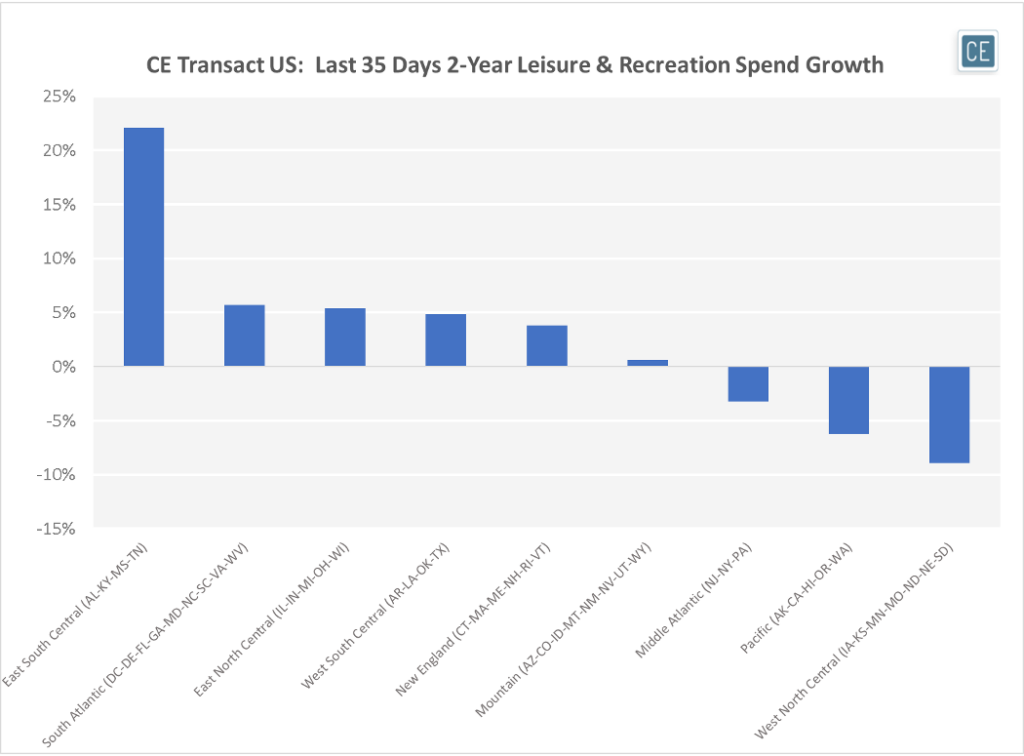
Within America, there were some differences in growth depending on where the cardholder lived as well. The East South Central area saw the strongest growth in Leisure & Recreation spend on a two-year basis. The West North Central residents, Pacific residents, and Middle Atlantic residents all spend less on Leisure & Recreation than they did two years ago.
Two-Year Growth by US Census Division
To learn more about the data behind this article and what Consumer Edge Research has to offer, visit www.consumer-edge.com.


Sign up to receive our stories in your inbox.
Data is changing the speed of business. Investors, Corporations, and Governments are buying new, differentiated data to gain visibility make better decisions. Don't fall behind. Let us help.


Sign up to receive our stories in your inbox.
Data is changing the speed of business. Investors, Corporations, and Governments are buying new, differentiated data to gain visibility make better decisions. Don't fall behind. Let us help.


