
Talk to any Gen Zer and ask them about the last commercial they saw. Chances are they don’t even watch cable.
Gone are the days when you were forced to watch “whatever’s on”. Now, we live in the golden age of video content with endless options of digital entertainment available to watch whenever, however, and wherever we want.
When the COVID-19 pandemic hit and museums, malls, and other outlets shut down, the need for entertainment at your fingertips boomed, and with it, the number of digital streaming options to choose from.
But as the world reopens, which streaming stars will be able to retain their new users?
Let’s see which platforms are keeping customers stuck to their screens and which are getting switched off, plus prime opportunities to win viewership from competitors through the magic of market intelligence.
Streaming wars: the current leaderboard
With so many streaming platforms available today, the first step of your benchmarking strategy should be to identify your main competitors. Enter benchmarking, the key to smart decision-making, user retention, and success based on size, audience demographics, or audience geography. But in this article, we’re getting straight to the good stuff by focusing on the top five industry leaders in terms of traffic share and monthly visits.
The winner so far this year? YouTube.com. The video streaming OG owned 60.93% of the total traffic share worldwide in Jan 2022. Netflix.com, it’s closest competitor, owned 4.7%, followed by imdb.com (1.0%), hotstar.com (0.67%), and hulu.com (0.4%). In addition to these streaming services, other top providers in the U.S. include hbomax.com, peakcocktv.com, and vimeo.com.
In addition to pointing TV junkies in the right direction toward the best sites to binge their favorite shows, imdb.com offers its own streaming services. Thanks to this twofold tactic, the site snagged 584.9 million monthly views in Jan. 2022.
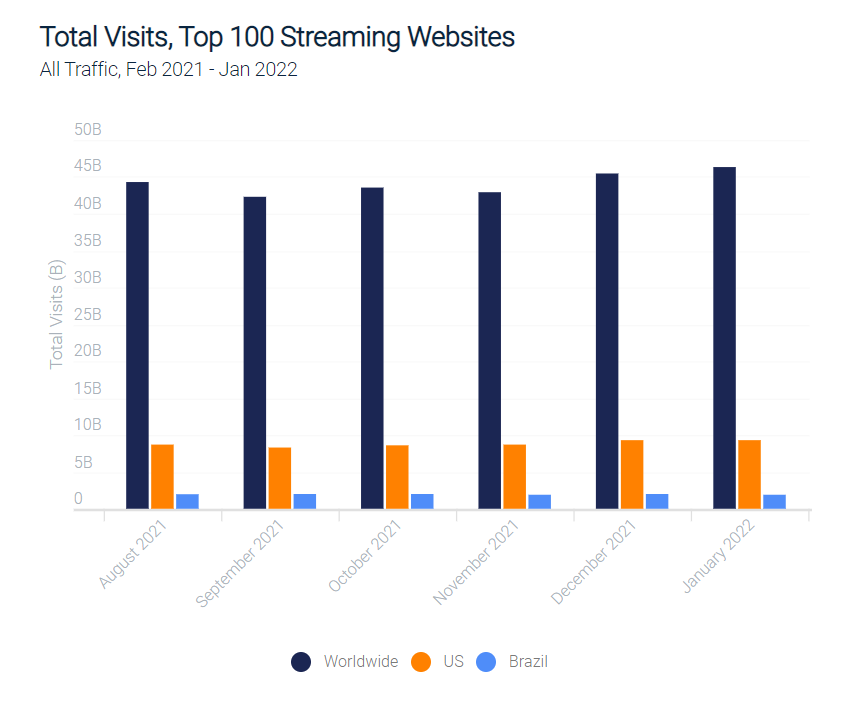
When we look at the top three websites for streaming TV and movies – the impact of COVID-19 becomes even more apparent.

Between Nov. 2021 and Dec. 2021, Netflix grew Netflix.com grew 9% before leveling out in Jan. 2022.
Now that you’ve got a better idea of how industry leaders are performing, let’s take a look at the average industry benchmarks for streaming sites to give you a broader picture of performance metrics to beat.
Total visits is one of the first website metrics you should evaluate to get a clear view of where you stand in the market.
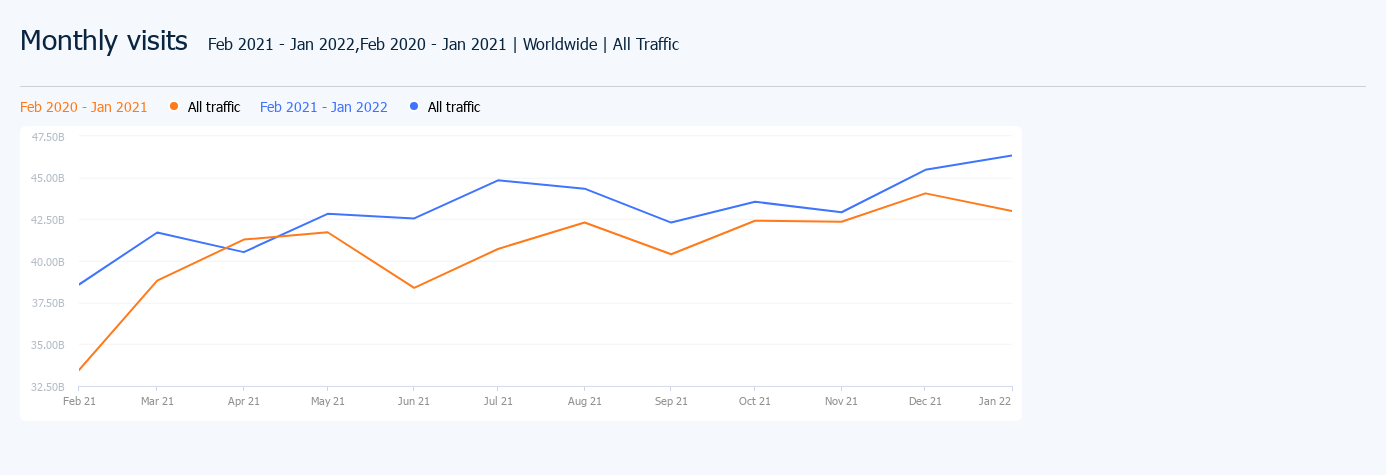
When comparing 2020 to 2021, the top 100 websites in the TV, movie, and streaming category had a 515.9 billion total, 5.5% more than the year before (488.9 billion). That’s a lot of eyeballs.
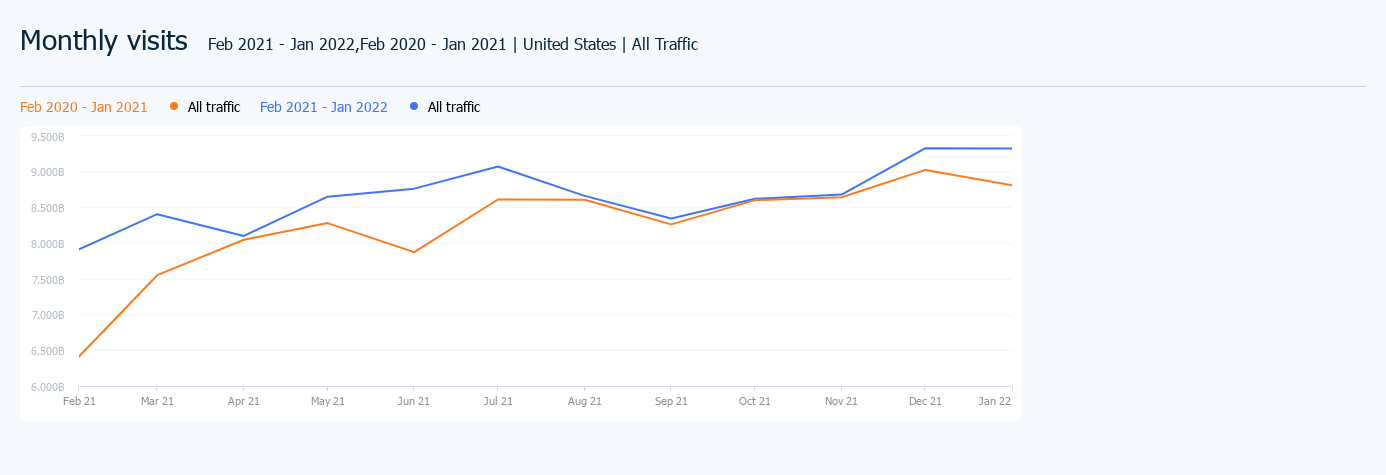
In the United States, streaming websites saw a 5.21% increase in total visits YoY from 2020 to 2021, rising to 103.8 billion.
In the last six months, traffic dipped slightly from 44 billion globally to 42 billion, before picking up to 46 billion in the last month – despite the continued relaxing of COVID-19 restrictions, users may have opted to stay inside and stream than venture out quite yet – especially in colder areas.
Sticky streaming
For online streaming, the stickier your website is, the more your viewers are enjoying your content. If you’ve got a sticky website, your users are happy with the services you offer and your audience is loyal to you.
Website stickiness is calculated by dividing the average number of unique visitors by the average total monthly visits. Remember that a unique visitor is one visiting your site or page within the specified period is counted only once.
Top 100 websites in the category, May 2021, Worldwide:
Top 25 websites in the category, May 2021, Worldwide::
If you have a stickiness level higher than 9%, you can assume that you’re providing a better user experience than most of the top competitors in the streaming industry. Well done!
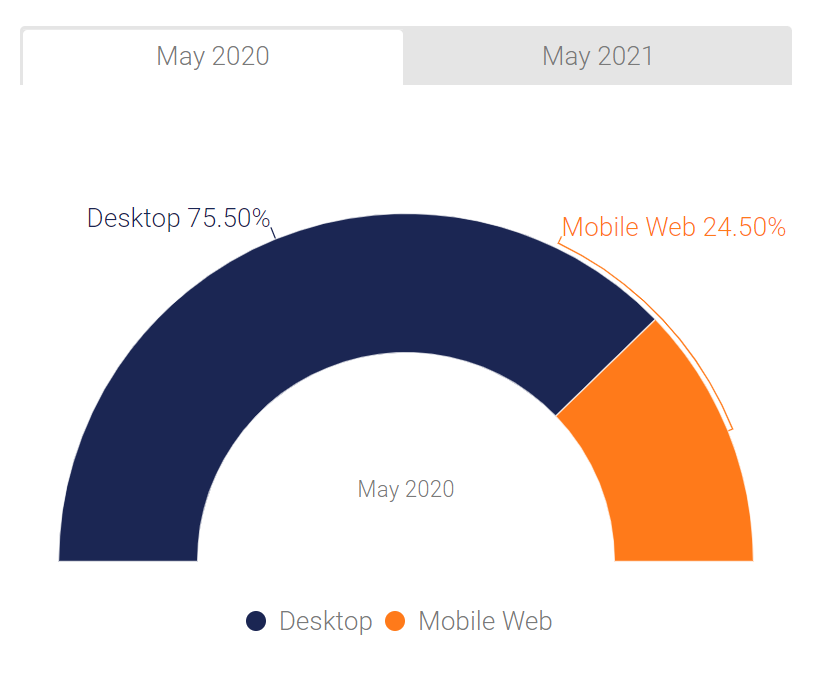
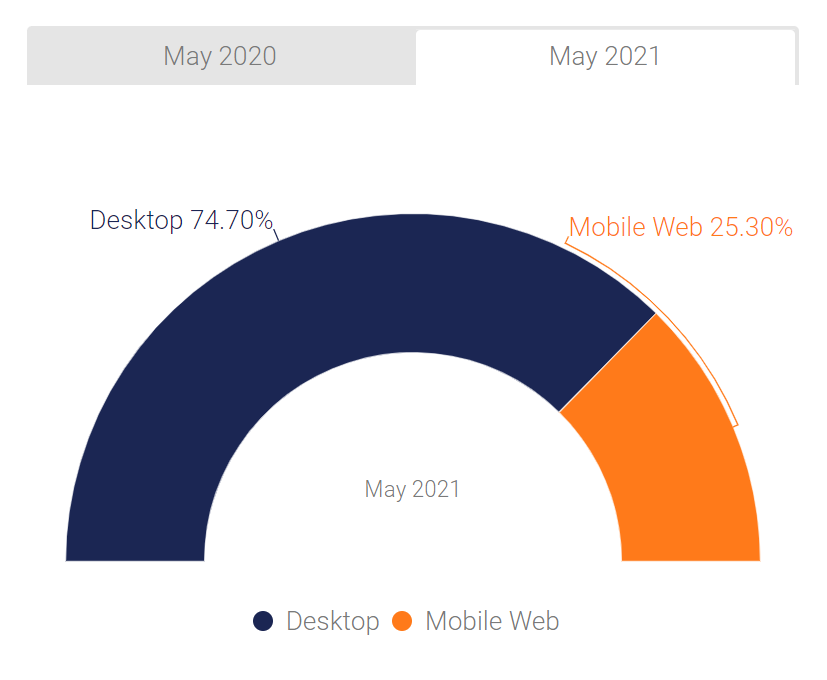
The device divide
Data on device divide can help gauge audience streaming preferences. Are your viewers more likely to watch your content at home from a desktop computer, or on the go via their mobile devices?
Understanding how your audience consumes your content is key to optimizing your streaming service for peak performance. For online streaming, desktop is the winner, indicating that most consumers access these websites when they’re relaxing or looking for entertainment while at home, rather than on the move – we’re looking at you, Netflix-and-chillers.
Top 100 websites in the category:
Top 25 websites in the category:
The deep dive
So how does a user end up on a certain streaming site? It could be through traditional word-of-mouth, affiliate marketing, paid advertising, or social media sharing – but no matter the method – it’s important to understand which marketing channels are bringing the most amount of traffic to your website.
Back at it with the benchmarking. Pinning your channels’ performance against your competitors will help you plan and implement changes to steal traffic share from your competitors. For example, if you notice that you fall below the industry benchmark for social media, perhaps you’ll want to boost your PPC strategy.
January to May 2021, direct has been the main source of traffic to streaming websites with a solid 78% of the traffic share. Organic search comes in second place at 16.5% and social in third at 2.8%.
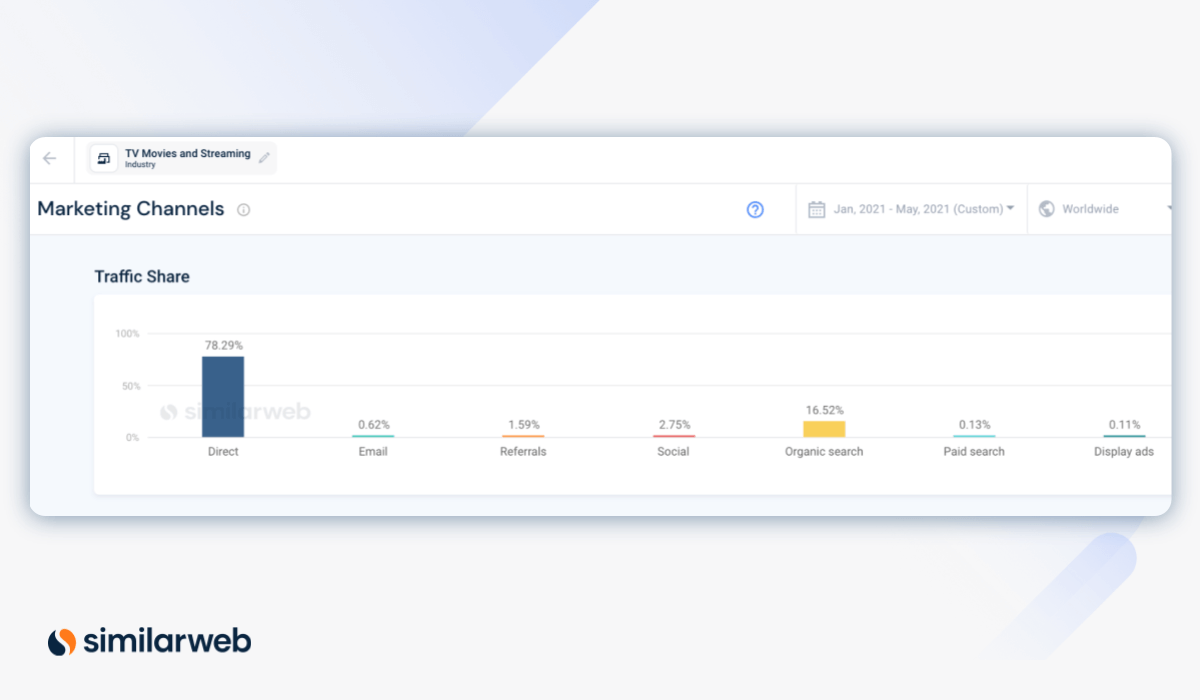
It’s interesting to note that in May 2021, almost all of the top streaming websites scored higher than the industry average for direct traffic. In fact, hulu.com, which had considerably less traffic than youtube.com and netflix.com in May 2021, wins overall for direct traffic – earning 91.4% of its traffic from this channel.

Keep users coming back
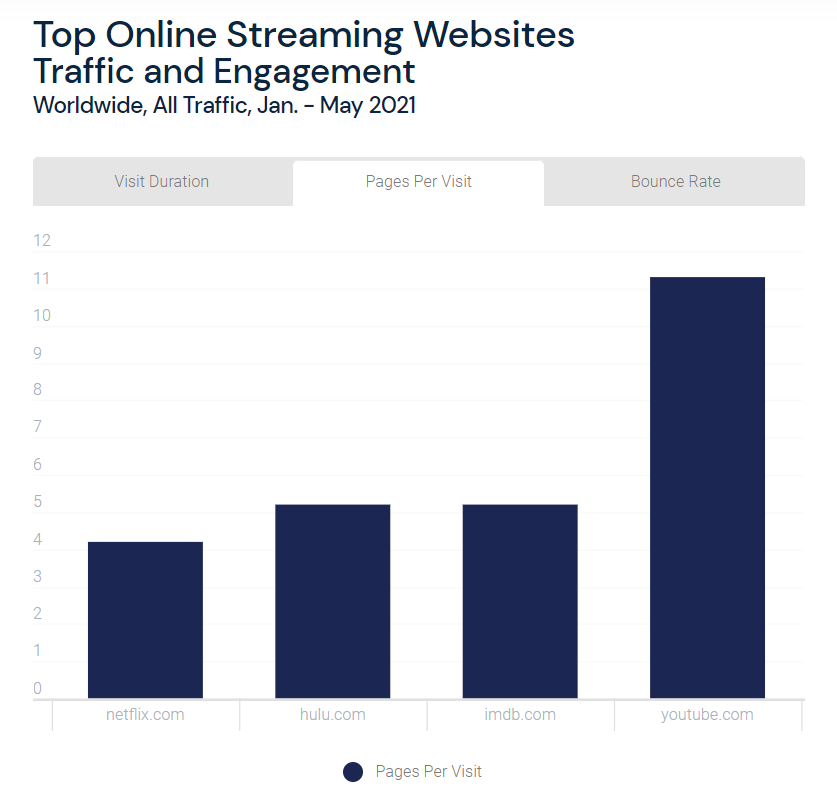
There are three key metrics you should be tracking to measure your visitors’ on-site experience and engagement with your website:
Below are user experience benchmarks for streaming websites globally and in the U.S. (August 2021 – January 2022):
Top 100 websites in the category globally, all traffic
Top 100 websites in the category in the U.S., all traffic
When looking at the top five websites globally, youtube.com has the best engagement metrics overall, followed by hulu.com.


The average streamer
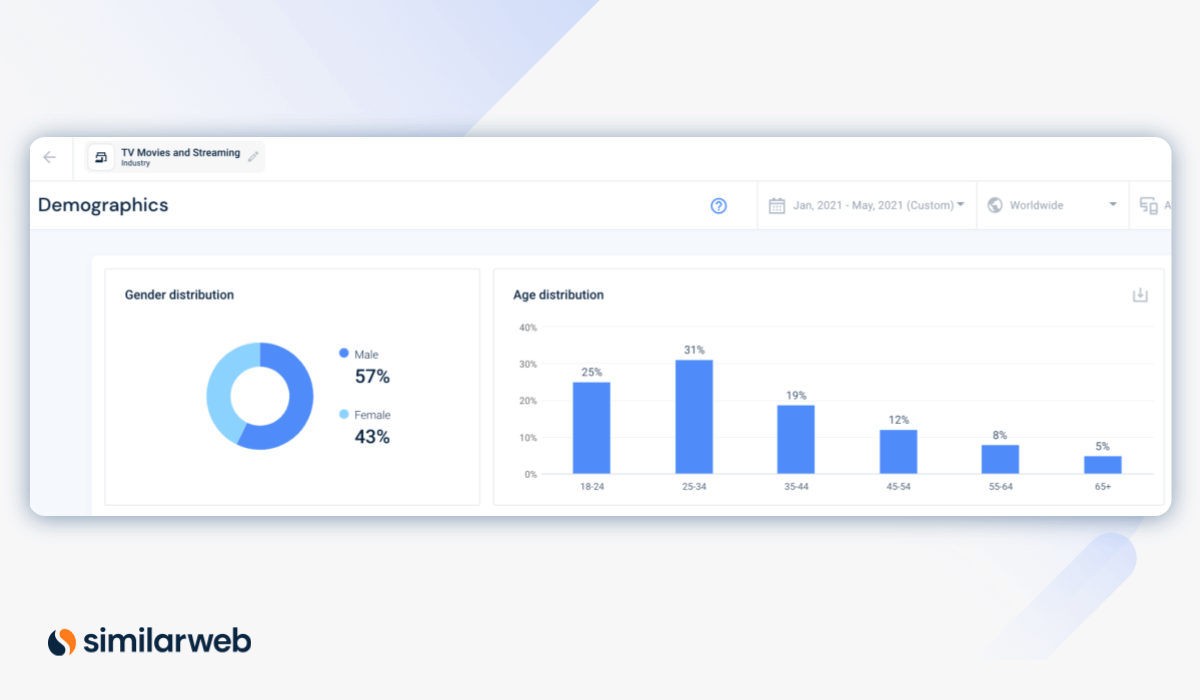
One of the final steps of your benchmarking strategy is to figure out who is coming to your website, and if that differs at all from the industry norm. Knowing how your target audience differs (or resembles) your competitors will give you an advantage for any business venture.
With the right data collection, you’ll be able to expand user reach, grow into new markets, and ultimately win consumers away from your competitors.
Males are slightly more likely to visit streaming websites than females. And age distribution for this industry tends to skew younger, with 57% falling between 18–34 years old.
Benchmarking with data
As the video streaming wars wage on, bet on benchmarking as the key to your success. But, in order to benchmark accurately, you’ll need reliable data on the digital world around you.
To learn more about the data behind this article and what MediaRadar has to offer, visit https://mediaradar.com/.


Sign up to receive our stories in your inbox.
Data is changing the speed of business. Investors, Corporations, and Governments are buying new, differentiated data to gain visibility make better decisions. Don't fall behind. Let us help.


Sign up to receive our stories in your inbox.
Data is changing the speed of business. Investors, Corporations, and Governments are buying new, differentiated data to gain visibility make better decisions. Don't fall behind. Let us help.