
Introducing the Apartment List Vacancy Index
At Apartment List, our research team is committed to providing accurate and timely data so that those interacting with today’s quickly changing housing market can make well-informed decisions. For years, our Monthly Rent Estimates have equipped researchers, journalists, industry specialists, and the general public with data on the latest pricing trends. Today, we’re thrilled to announce the release of our newest data product – the Apartment List Vacancy Index.
While this isn’t the first time that we’ve presented data on vacancy trends, we’re now officially making that data publicly available on our data download page, with trends going back to 2017 for hundreds of individual locations across the U.S. at various geographic levels (national, state, metro, county, and city). Read on for an overview of the latest trends we’re seeing in this data, and for those interested in learning more about how we arrived at these numbers, we’ve included a thorough explanation of our methodology.
Vacancies are gradually opening back up, but the market remains historically tight
In the years preceding the pandemic, our national vacancy index was quite stable. From January 2017 through February 2020 our monthly reading of the national vacancy rate averaged 6.7 percent, never falling below 6.3 percent or rising above 7 percent. This level of vacancies was consistent with a healthy degree of turnover in the market during a time when rents nationally were increasing by a modest rate of around 2 to 3 percent annually.
**
Apartment List Vacancy Index**
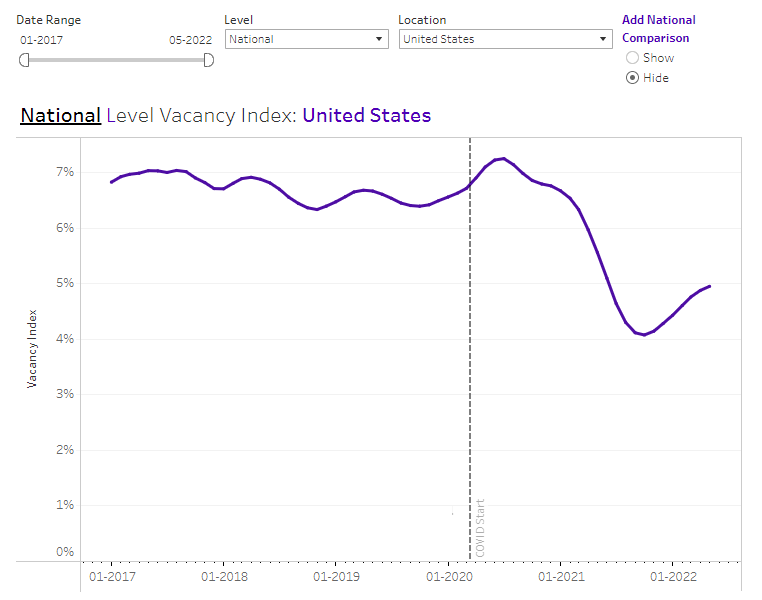
Since the start of the pandemic, however, the trend in the vacancy index has been reflective of the most tumultuous years for the rental market in recent memory. In the earliest months of the pandemic, our index spiked from 6.6 percent in February 2020 to a peak of 7.3 percent in July of that year, as many Americans moved in with family or friends amid the uncertainty and economic disruption of the pandemic’s onset. But after that brief spike, vacancies began a steep decline as the rental market quickly tightened. This decline began in the second half of 2020, but by the end of that year, our index still stood at 6.8 percent, consistent with the pre-pandemic average. In 2021, however, the vacancy index plunged well below that healthy rate, eventually bottoming out at a low of 4.1 percent in October of last year.
This tightening was driven by a number of factors. Household formation spiked as many of those who had been living with family or roommates decided to move out on their own. At the same time, more and more renters with existing leases were staying put, and delays to the construction pipeline limited the number of new units hitting the market. These factors collided to form a landscape in which more households were competing for fewer available units. This extreme tightness drove unprecedented rent growth, with the national median rent climbing by 17.3 percent over the course of 2021. Meanwhile, similar conditions in the for-sale market drove up the price of homeownership, putting additional top-down pressure on the rental market.
Our vacancy index bottomed out in October 2021, and since then, the situation has been gradually easing. Our vacancy index has now ticked up for seven consecutive months, reaching 5 percent in May 2022. Our rent growth index shows a corresponding trend, as price growth has decelerated this year compared to 2021. But despite these improvements for renters, the market remains tight by historical standards, and prices are still going up today faster than they did pre-pandemic.
Vacancies have disappeared from the markets where they had spiked most
While our national vacancy index exhibited only a modest increase in the early part of the pandemic, the nation’s priciest coastal markets experienced what some referred to at the time as an “exodus.” While the term exodus was probably always something of an exaggeration, our city-level vacancy indices for some of these markets do indeed show that a significant number of renters gave up their leases in 2020 without new renters coming in to take their places:
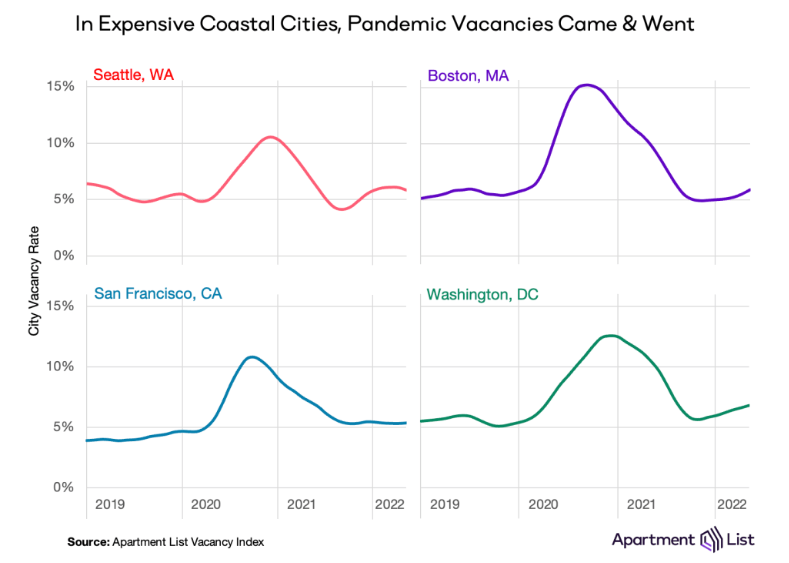
San Francisco, Boston, Seattle, and Washington, D.C. all saw their vacancy rates rise above 10 percent by late 2020, and in Boston in particular, our vacancy index peaked at a staggering 15.5 percent in September of that year. In order to fill the growing number of empty units, property managers in these markets slashed prices. By the end of 2020, the median rent in San Francisco had dropped by 26 percent – the nation’s sharpest decline – while Seattle and Boston both saw declines of 21 percent. Rents in D.C. fell by 13 percent; a more modest decline compared to the others, but still a tremendous dropoff by historic standards.
However, beginning in 2021 and continuing into this year, all of these markets experienced strong rebounds, reflected in both prices and vacancies. As can be seen above, vacancies have tightened significantly in these markets, and as of our most recent estimate, none of these cities has a vacancy rate above 7 percent. At the same time, rents have also bounced back. In Seattle, Boston, and DC (as well as many other similar cities across the country that were greatly impacted by the pandemic), rents are back above pre-pandemic levels. San Francisco is one of very few cities still experiencing a pandemic “discount,” but even there, rents are up 20 percent since January 2021.
Some of the hottest markets are cooling, but only modestly
At the other end of the spectrum, some lower-cost parts of the country never saw a spike in apartment vacancies, nor a substantial drop in prices. In contrast, their supply of vacant units dwindled last year, pushing up rents rapidly. Florida is the epicenter of this trend, but markets across the Sun Belt and others in the suburban regions of major metropolitan areas have experienced a similar trend. Phoenix, Raleigh, Dallas, and Tampa are examples that have all seen median rent prices surge by more than 20 percent since March 2020. An influx of new renters to these markets led to sharp dips in our vacancy indices for each of these cities:
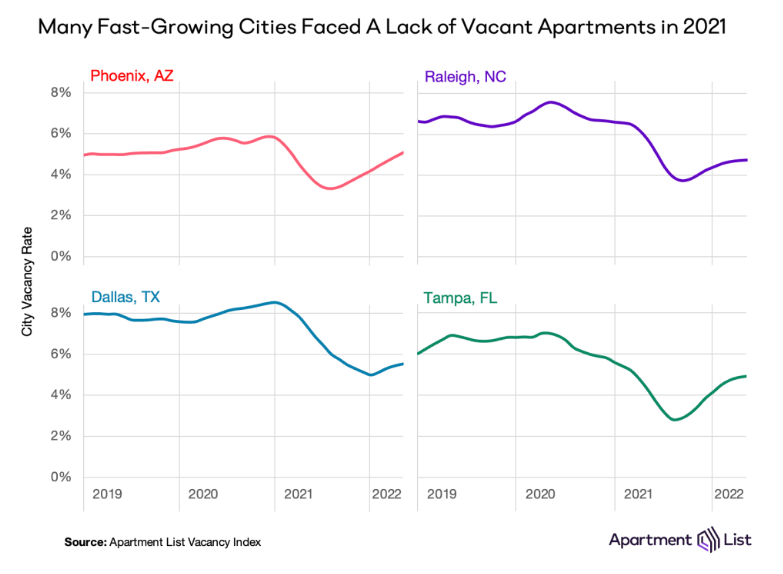
With the exception of Dallas, the vacancy rates in these cities bottomed out at levels even lower than of our national index. The most extreme tightening can be seen in Tampa, where rents have spiked by a staggering 38 percent since the start of the pandemic, and where the vacancy index dipped below 3 percent last fall. Thankfully for renters in these markets, the situation has shown signs of stabilizing in recent months. In Phoenix, for example, rents have increased by just 2 percent over the past six months, during which time the city’s vacancy index has gradually eased back to 5 percent, close to where it was before the onset of the pandemic. The other cities shown above have also seen their vacancy rates tick up in recent months, but to lesser degrees.
Where are vacancy rates headed going forward?
After experiencing significant disruption over the past two years, the rental market has begun to gradually stabilize. The markets that saw large spikes in vacancies in the early pandemic have since seen renters return. Meanwhile, demand has started to level off in the nation’s hottest markets. That said, the availability of vacant units nationally remains notably constrained compared to the pre-pandemic norm. Even if our national vacancy index continues its gradual easing, it won’t surpass 6 percent until well into next year on its current trajectory.
Furthermore, there are factors at play which could present headwinds to that easing. Although we’re now at the start of the busy season for the rental market, when the bulk of moving activity normally takes place, rapidly rising rents may incentivize many renters to stay put and renew existing leases rather than looking for new ones. At the same time, the recent spike in mortgage rates has created yet another barrier to a historically difficult for-sale market, potentially sidelining would-be homebuyers and keeping them in the rental market. Given these factors, it’s possible that the easing of our vacancy index could level off in the coming months.
Methodology
To calculate our vacancy index, we leverage the extensive dataset that powers our platform. Apartment List maintains robust data integrations with the properties that list with us, allowing us to track pricing and availability changes as soon as they occur. This not only creates a great experience for our users, but also gives us unique insight into trends in the rental market. For every property on our platform, we know the total number of units in the building, as well as the number that are vacant on any given day, allowing us to calculate a daily vacancy rate for each property in our sample. Our monthly vacancy index for a given location is calculated by taking an average of the daily vacancy rates for each property and then averaging the rates of all the properties that fall within the bounds of the given location (city, county, metro, state, or national), weighted by the number of units in each property.
While the explanation above accurately describes our general approach, the complete calculation involves additional nuances that are important to note. Most crucially, the simplest version of this calculation ignores a key limitation – a given property’s vacancy rate is not independent of its decision to list with Apartment List. Rather, those properties which have the greatest need to fill vacancies are most likely to find value in partnering with us. As shown below, in the first months when a property appears on our platform, they tend to have elevated vacancy rates, which then gradually stabilize over time:
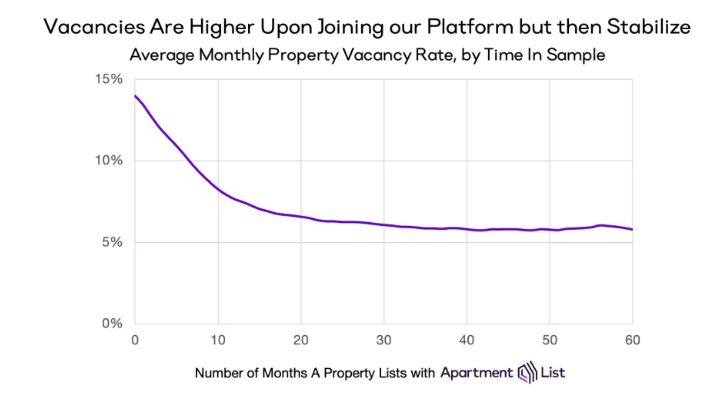
In order to control for this selection bias, we exclude new properties from the sample for our vacancy index calculation until they have been on the platform for at least six months. For “lease-ups” – newly developed properties that start off entirely vacant – we impose a stricter criteria, excluding data for six months after the first month in which the property is at least 50 percent occupied, allowing additional time for the property’s occupancy to stabilize before we enter it into our sample.
After applying these filters, we then calculate our index for all locations in which we have sufficient data. In order to publish a vacancy index for a given location, we require that our sample for that location consists of at least 25 properties in each individual month over the course of the past year. We include a longer history for a location only when sample sizes continue to exceed the minimum sample threshold. Importantly, our inventory is heavily skewed toward large multi-family properties, meaning that even with a relatively small number of properties, we are able to observe a large number of individual units. Among all cities where we publish a vacancy index, the average monthly sample consists of more than 17,000 units.
Based on the methodology described above, our resulting vacancy index serves as a valuable and timely new indicator of trends in the rental market. As expected, it exhibits a strong inverse relationship with our existing estimates of rent growth:
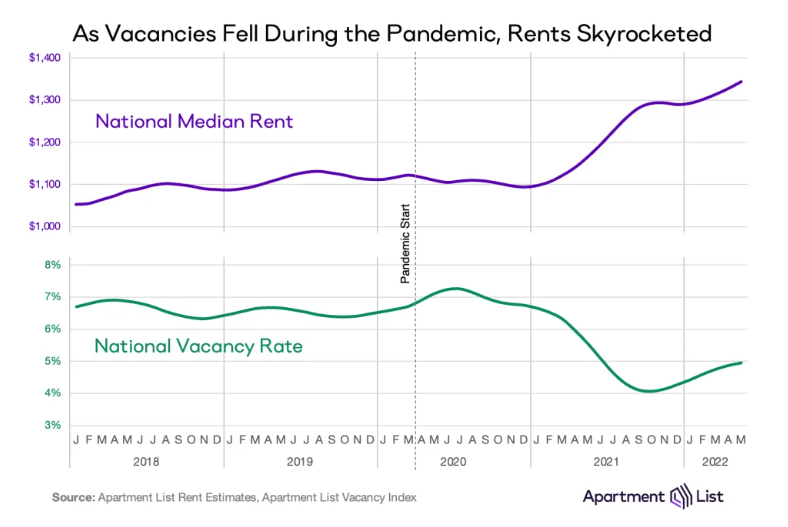
Comparing the national median rent in the top panel to the national vacancy index in the bottom panel, we see that when our vacancy index tightens, prices tend to increase, and vice versa. This relationship can be understood intuitively through a simple supply and demand framework. When properties have a large number of vacant units that are failing to attract renters, property managers are likely to lower their asking prices in order to spur demand. Conversely, when renters are competing for a tight supply of available vacancies, property managers are able to raise prices. The fact that these two data series demonstrate this relationship so clearly serves as a validation that our index is accurately capturing the dynamics at play in the market
While we are confident in our methodology and the accuracy of our index, it is nonetheless important to also acknowledge its limitations. As mentioned above, our sample of properties is heavily skewed toward large multi-family apartment complexes, generally containing 50 units or more per property. It is conceivable that occupancy trends in this segment of the market differ from those of smaller rental properties. In this sense, our index may not be fully representative of the market as a whole. Additionally, it is important to bear in mind that the properties that list with us have self-selected into our platform, generally because they have a perceived need for assistance in filling vacancies. While we partially control for this in the manner described above, it may be the case that even after the initial stabilization period, the properties on our platform continue to have higher vacancy rates than the market-wide norm. Finally, our methodology does not fully control for the composition of our sample; in other words, new properties are gradually added to the sample over time, while others may drop out, meaning that the sample of properties that we observe varies somewhat month-to-month.
To learn more about the data behind this article and what Apartment List has to offer, visit https://www.apartmentlist.com/.


Sign up to receive our stories in your inbox.
Data is changing the speed of business. Investors, Corporations, and Governments are buying new, differentiated data to gain visibility make better decisions. Don't fall behind. Let us help.


Sign up to receive our stories in your inbox.
Data is changing the speed of business. Investors, Corporations, and Governments are buying new, differentiated data to gain visibility make better decisions. Don't fall behind. Let us help.