Data Through Q1 2022
Introduction
The CoreLogic Homeowner Equity Insights report, is published quarterly with coverage at the national, state and Core Based Statistical Area (CBSA)/Metro level and includes negative equity share and average equity gains. The report features an interactive view of the data using digital maps to examine CoreLogic homeowner equity analysis through the first quarter of 2022.
Negative equity, often referred to as being “underwater” or “upside down,” applies to borrowers who owe more on their mortgages than their homes are worth. Negative equity can occur because of a decline in home value, an increase in mortgage debt or both.
This data only includes properties with a mortgage. Non-mortgaged properties (that are owned outright) are not included.
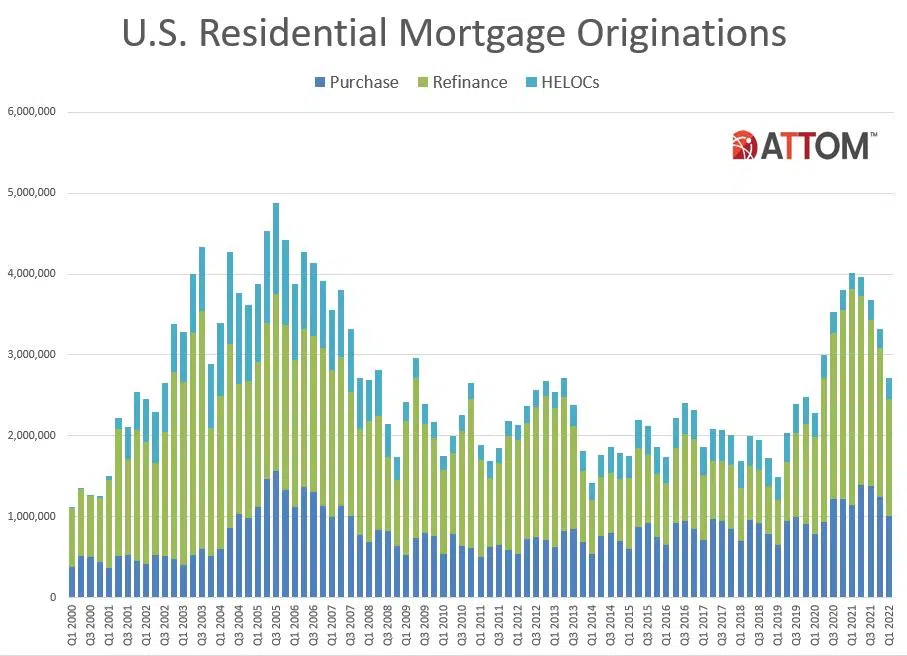
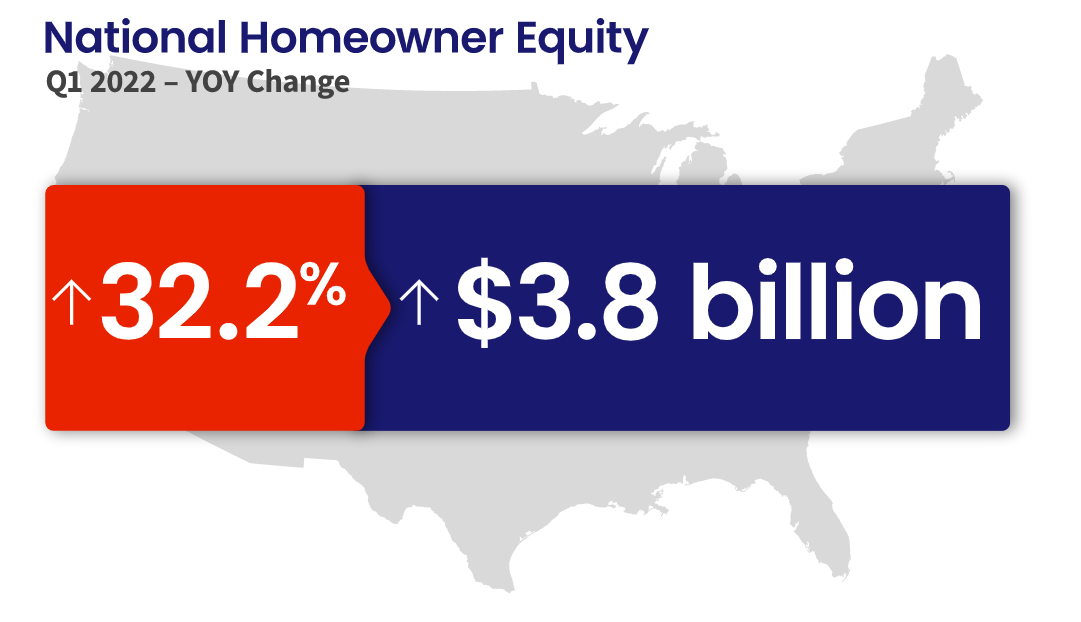
Homeowner Equity Q1 2022
CoreLogic analysis shows U.S. homeowners with mortgages (roughly 62% of all properties*) have seen their equity increase by a total of over $3.8 trillion since the first quarter of 2021, a gain of 32.2% year over year.
*Homeownership mortgage source: 2016 American Community Survey.
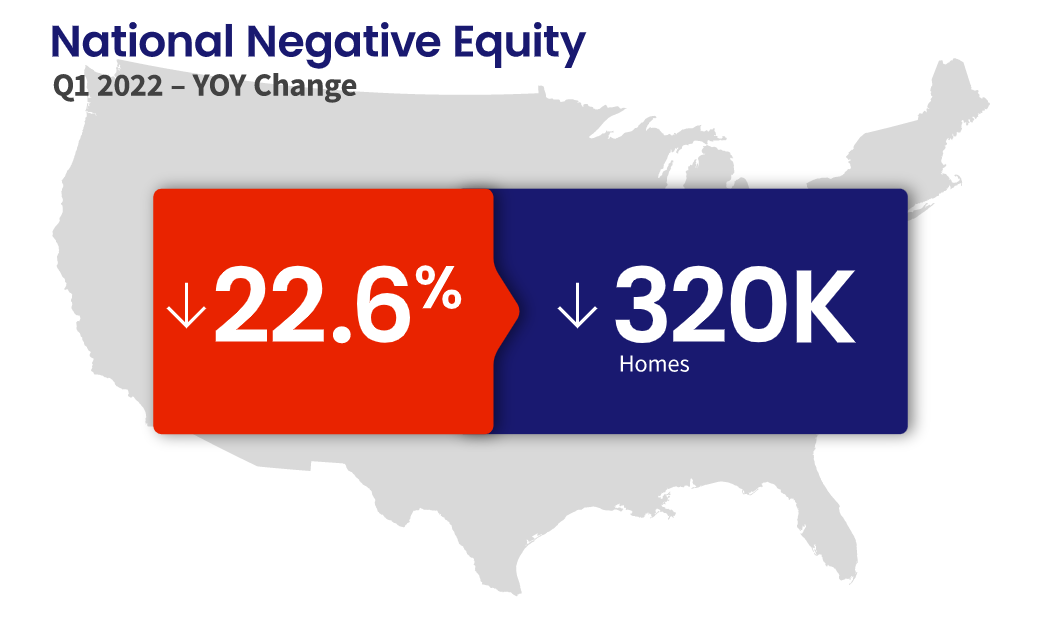
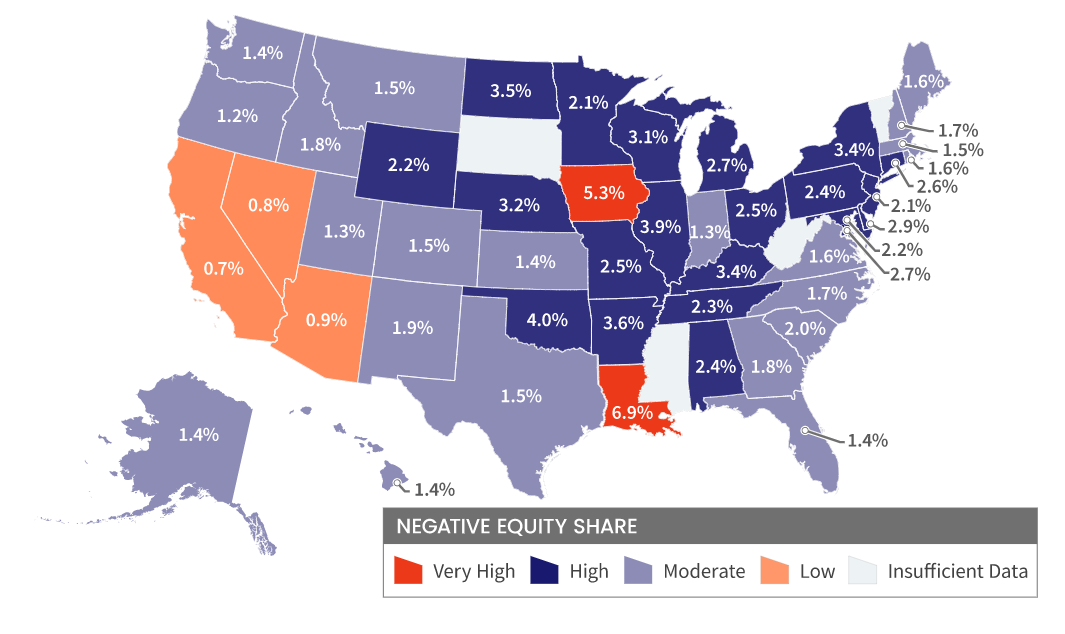
Negative Equity Falls
In the first quarter of 2022, the total number of mortgaged residential properties with negative equity decreased by 5.3% from the fourth quarter of 2021 to 1.1 million homes, or 2% of all mortgaged properties. On a year-over-year basis, negative equity fell by 23% from 1.4 million homes, or 2.6% of all mortgaged properties, in the first quarter of 2021.
Because home equity is affected by home price changes, borrowers with equity positions near (+/- 5%) the negative equity cutoff are most likely to move out of or into negative equity as prices change, respectively. Looking at the first quarter of 2022 book of mortgages, if home prices increase by 5%, 130,000 homes would regain equity; if home prices decline by 5%,167,000 would fall underwater. The CoreLogic HPI Forecast TM projects home prices will increase 5.9% from March 2022 to March 2023.
Economic Impact
U.S. home prices continued their upward trajectory in the first quarter of 2022, with year-over-year growth averaging around 20%, allowing 62,000 owners to regain equity compared with the previous quarter. Homeowners in California, Hawaii and Washington led the U.S. for annual equity increases in the first quarter of this year, all gaining more than $100,000. Only 2% of homeowners with a mortgage remain underwater, a slight decline from the fourth quarter of 2021.
National Aggregate Value of Negative Equity: Q1 2022
The national aggregate value of negative equity was approximately $298 billion at the end of the first quarter of 2022. This is up quarter over quarter by approximately $9 billion, or 3.1%, from $289 billion in the fourth quarter of 2022 and up year over year by approximately $26 billion, or 8.2%, from $275 billion in the first quarter of 2021..
Negative equity peaked at 26% of mortgaged residential properties in the fourth quarter of 2009, based on the CoreLogic equity data analysis which began in the third quarter of 2009.
Price growth is the key ingredient for the creation of home equity wealth. Home prices were up by 20% in March compared to one year earlier in CoreLogic’s national Home Price Index. This has led to the largest one-year gain in average home equity wealth for owners and is expected to spur a record amount of home-improvement spending this year.”
-Patrick Dodd
President and CEO, CoreLogic
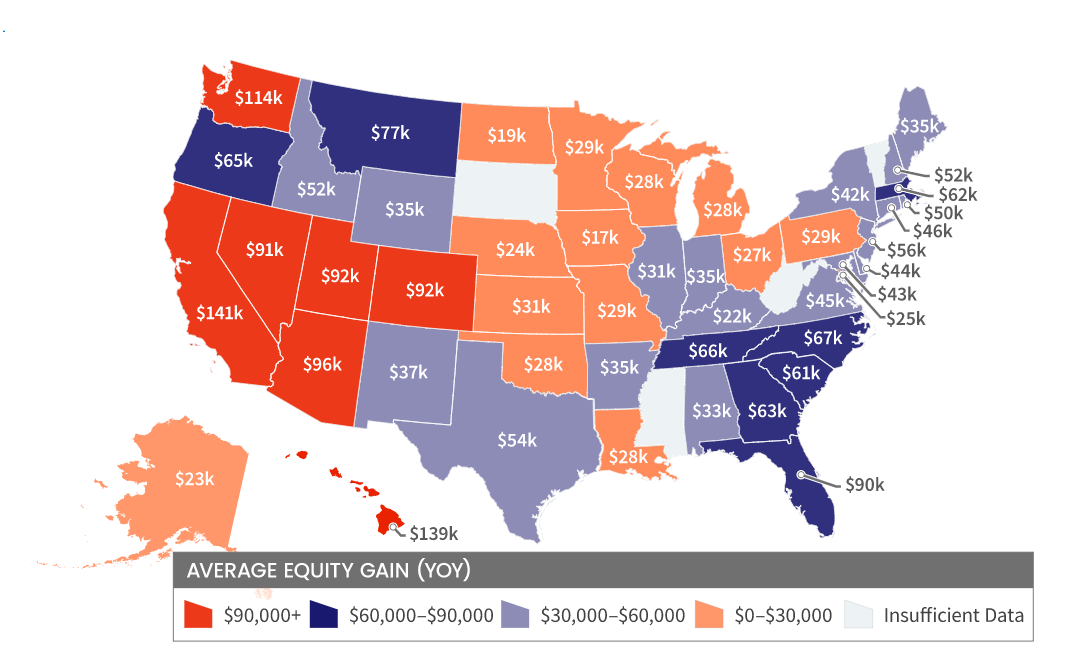
National Homeowner Equity
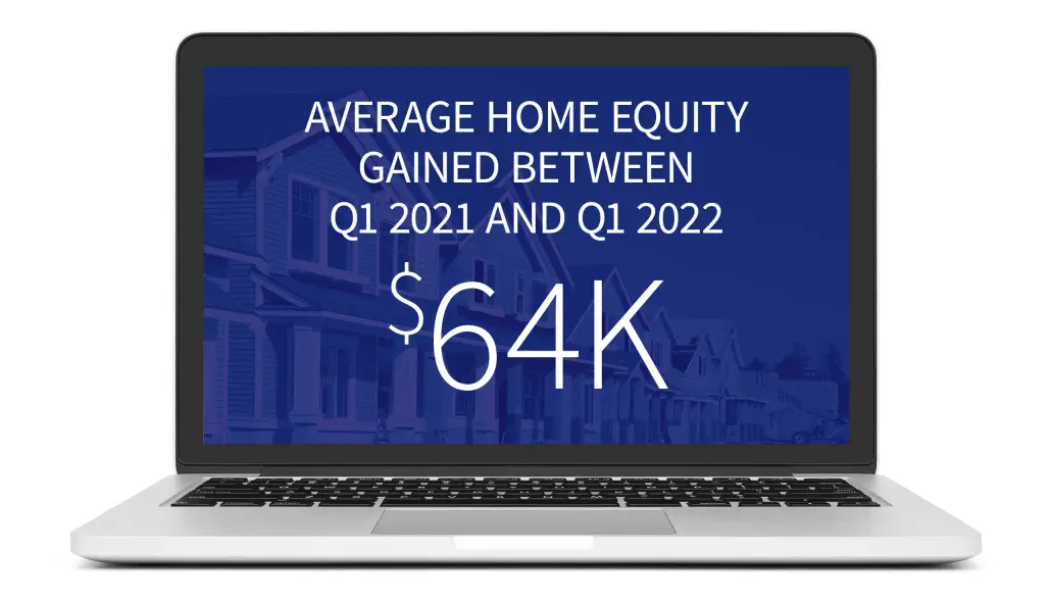
In the first quarter of 2022, the average homeowner gained approximately $64,000 in equity during the past year.
California, Hawaii and Washington experienced the largest average equity gains at $141,00, $139,00 and $114,00 respectively. Iowa and North Dakota experienced the lowest average equity gains in the first quarter of 2022, at $17,300 and $19,000 respectively.
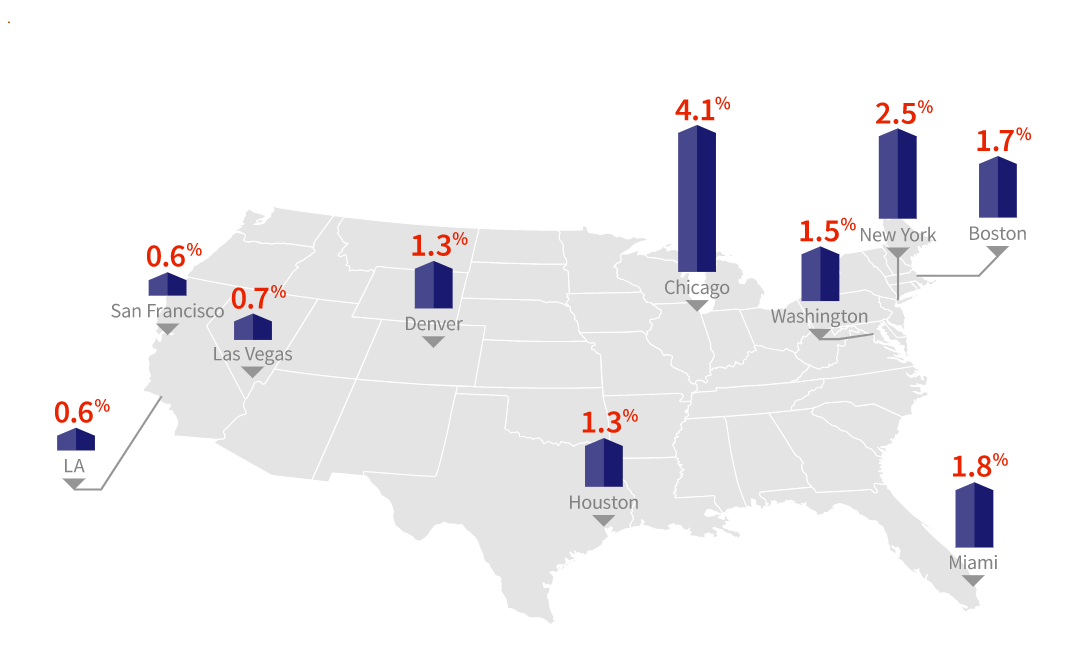
10 Select Metros Change
CoreLogic provides homeowner equity data at the metropolitan level, in this graphic 10 of the largest cities, by housing stock are depicted.
Negative equity has seen a recent decrease across the country. San Francisco and Los Angeles, are the least challenged, with Negative Equity Share of all mortgages at 0.6%.
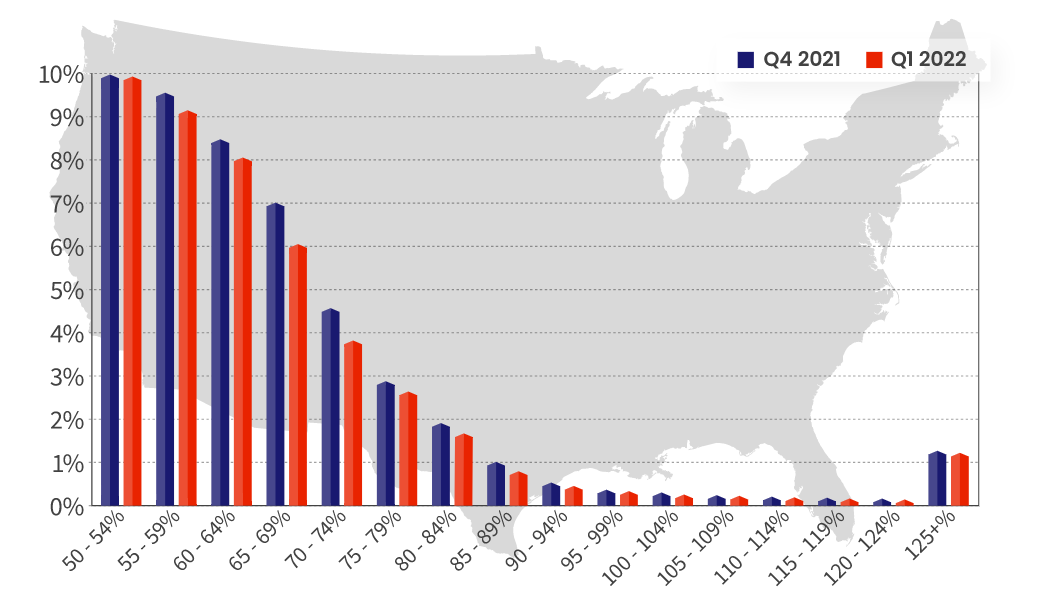
Loan-to-Value Ratio (LTV)
The graph represents National Homeowner Equity Distribution across multiple LTV Segments.
To learn more about the data behind this article and what CoreLogic has to offer, visit https://www.corelogic.com/.


Sign up to receive our stories in your inbox.
Data is changing the speed of business. Investors, Corporations, and Governments are buying new, differentiated data to gain visibility make better decisions. Don't fall behind. Let us help.


Sign up to receive our stories in your inbox.
Data is changing the speed of business. Investors, Corporations, and Governments are buying new, differentiated data to gain visibility make better decisions. Don't fall behind. Let us help.