Introduction
Welcome to the July 2022 Apartment List National Rent Report. Our national index rose by 1.3 percent over the course of June, consistent with last month’s increase. So far this year, rents are growing more slowly than they did in 2021, but faster than they did in the years immediately preceding the pandemic. Over the first half of 2022, rents have increased by a total of 5.4 percent, compared to an increase of 8.8 percent over the same months of 2021. Year-over-year rent growth currently stands at a staggering 14.1 percent, but has been trending down from a peak of 17.8 percent at the start of the year.
On the supply side, our national vacancy index ticked up slightly again this month, continuing a streak of gradual easing dating back to last fall. Our vacancy index now stands at 5 percent, up from a low of 4.1 percent, but remains well below the pre-pandemic norm. And with spiking mortgage rates sidelining potential homebuyers, we could see additional tightness in the rental market in the months ahead. Rents increased this month in 97 of the nation’s 100 largest cities. New York City has seen the nation’s fastest city-level rent growth over the past year, while some of the hottest Sun Belt markets are finally showing signs of plateauing growth.
Month-over-month rent growth holds steady with 1.3% increase; up 14.1% year-over-year
The national median rent increased by a record-setting 17.5 percent over the course of 2021. This rapid growth in rent prices is a key contributor to overall inflation, which is currently rising at its fastest pace in 40 years.1 With inflation top-of-mind for policymakers and everyday Americans alike, our rent index is particularly relevant, since movements in market rents lead movements in average rents paid. As a result, these rent dynamics signal what is likely ahead for the housing component of the official inflation estimates produced by the Bureau of Labor Statistics. Thankfully for the country’s renters, our index shows that rent growth in 2022 has cooled from last summer’s peaks. At the same time, however, rents are continuing to rise faster than they did in pre-pandemic years.
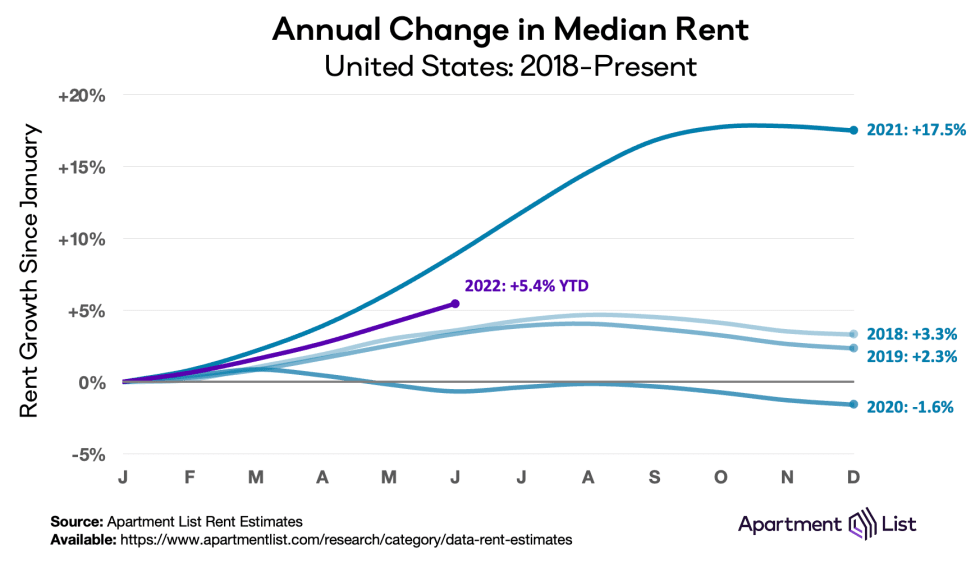
In the first half of this year, our national rent index has increased by 5.4 percent, well below last year’s 8.8 percent increase over the same months. However, this year’s pace is also still notably faster than that of the years prior to 2021. For comparison, rent growth from January to June totalled 3.1 percent in 2017, 3.6 percent in 2018, 3.4 percent in 2019, and -0.7 percent in 2020. The trend of rent growth is pacing well behind last summer’s scorching pace, but ahead of the pre-pandemic norm can also be seen in the following chart of month-over-month growth from 2018 to present.
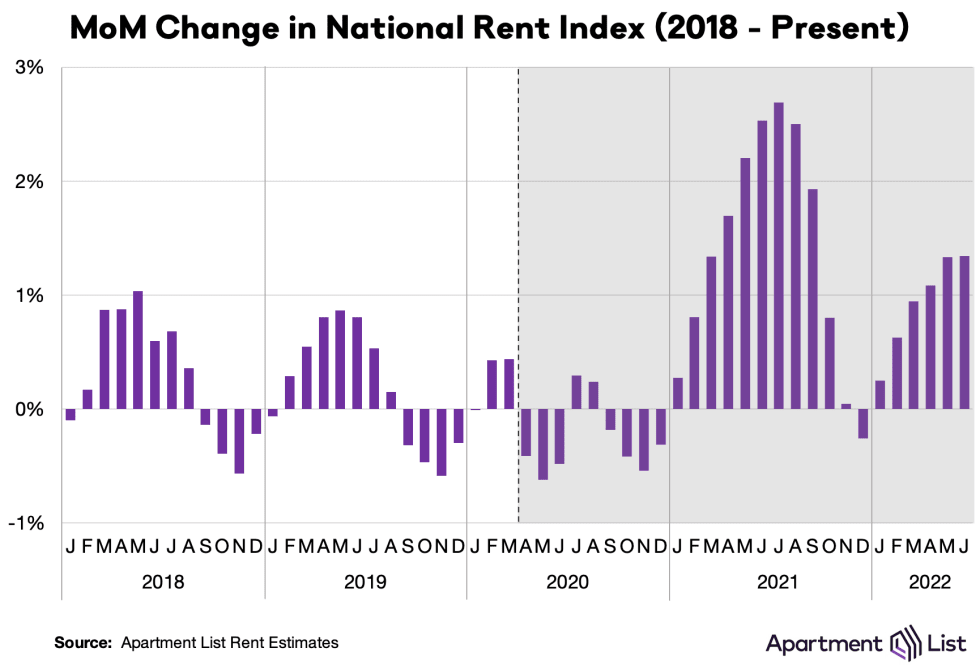
Our national rent index increased by 1.3 percent month-over-month in June, consistent with last month’s increase. In June 2021, our national rent index jumped by 2.5 percent month-over-month, nearly doubling this month’s increase. In contrast, from 2017 to 2019, month-over-month growth in June averaged 0.7 percent, just over half of this month’s increase. Over the past 12 months as a whole, rent prices have spiked by a staggering 14.1 percent nationally. That said, our year-over-year growth estimate has been gradually cooling in recent months after peaking at 17.8 percent in January, as monthly growth comes in slower than last year’s pace. Based on what we’ve seen so far this year, rent growth in 2022 seems likely to continue exceeding the pre-pandemic trend, even as it moderates substantially from 2021 levels.
Vacancy rate easing appears to be leveling off
As we’ve explored in detail, much of the 2021 rent boom was attributed to a tight market in which more households were competing for fewer vacant units. Our vacancy index spiked above 7 percent in the early months of the pandemic in 2020, as many Americans moved in with family or friends amid the uncertainty and economic disruption of the pandemic’s onset. After that, however, vacancies began a steady decline, eventually falling to a low of 4.1 percent.
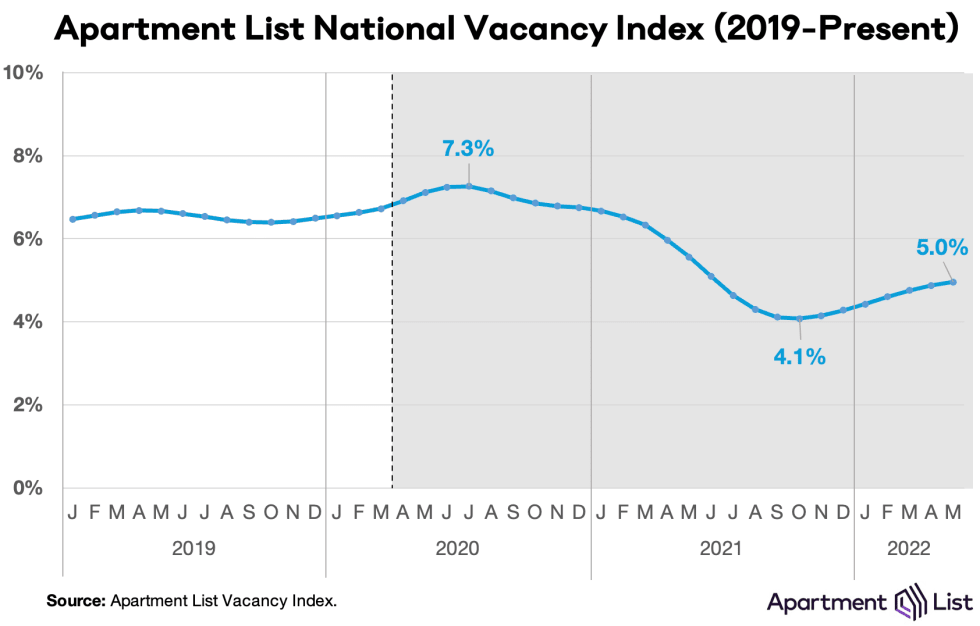
After bottoming out at 4.1 percent last October, our vacancy index has been on a trend of gradual easing. This month however, our index remained flat at 5 percent, after seven consecutive months of increases. It’s likely that spiking mortgage rates are beginning to sideline potential first-time homebuyers from the for-sale market, keeping these households in rental units for longer. And although we’re now in the midst of the busy season for the rental market, when the bulk of moving activity normally takes place, rapidly rising rents may be incentivizing many renters to stay put and renew existing leases rather than looking for new ones. These factors could be contributing to the flattening of our vacancy index at a level that is still far below the pre-pandemic norm.
Vacancy trends are highly localized, and they played a major role in determining how quickly rent inflation affected cities throughout the pandemic. To explore the topic in greater detail, monthly vacancy data are now available for download for hundreds of cities, metros, and states, and can be easily linked to our existing rent estimates.
Rents up month-over-month in 97 of 100 largest cities
The chart below visualizes monthly rent changes in each of the nation’s 100 largest cities from January 2018 to present. The color in each cell represents the extent to which prices went up (red) or down (blue) in a given city in a given month. In 2020, we can see that rents fell sharply in many of the nation’s largest and most expensive cities, while smaller and more affordable ones picked up steam, leading to some convergence in prices. Meanwhile, the dark red band in 2021 depicts last year’s rent heatwave, which peaked in July and August 2021 when all 100 cities in this chart saw prices go up. The rightmost columns show that virtually across the board, rent growth has cooled down from last year’s pace, but is continuing on an upward trajectory.
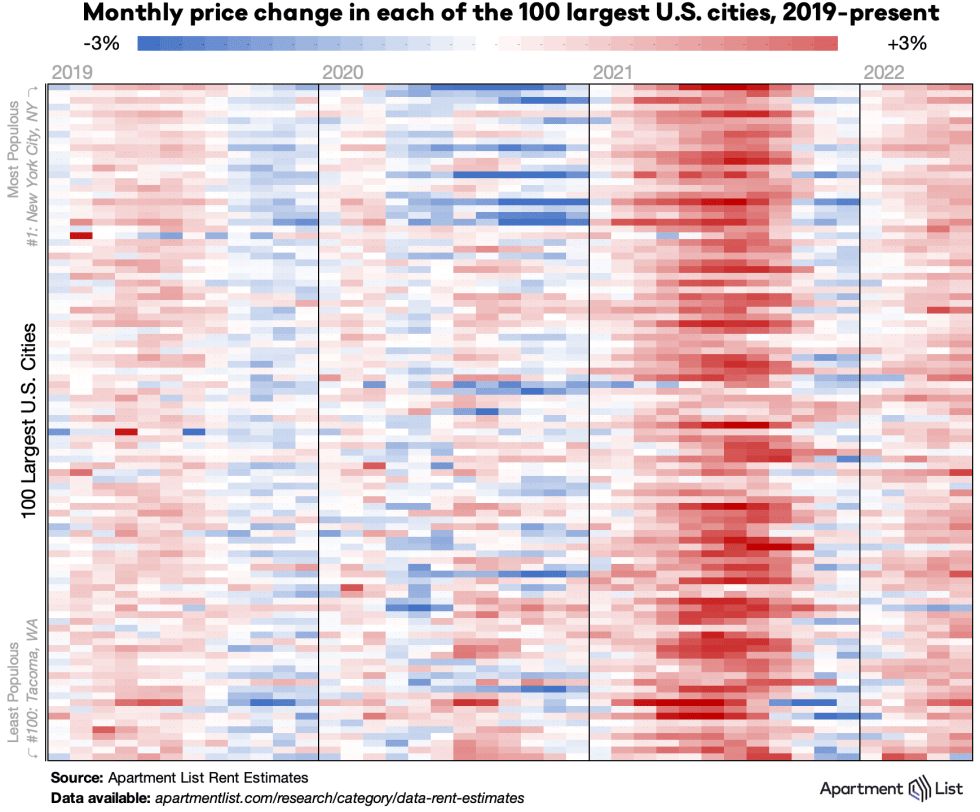
Rents increased this month in 97 of the nation’s 100 largest cities, but 73 of these cities have experienced slower rent growth in the first half of 2022 than they did over the same months of 2021. And in a small handful of these cities, rents are currently lower than they were at the start of the year. Most notably, rents in Scottsdale, AZ have fallen by 7 percent so far in 2022, exemplifying a broader cooldown in the Phoenix metro which we explore further below.
At the other end of the spectrum, New York City is currently experiencing the nation’s fastest rent growth at the city level. NYC rents are up by 27 percent over the past year, nearly doubling the national average. The city’s surging rents have more than made up for early-pandemic discounts – despite falling by 20 percent from March through December of 2020, the median rent in NYC is now 17 percent higher than it’s March 2020 level.
Coastal metros picking up steam in recent months
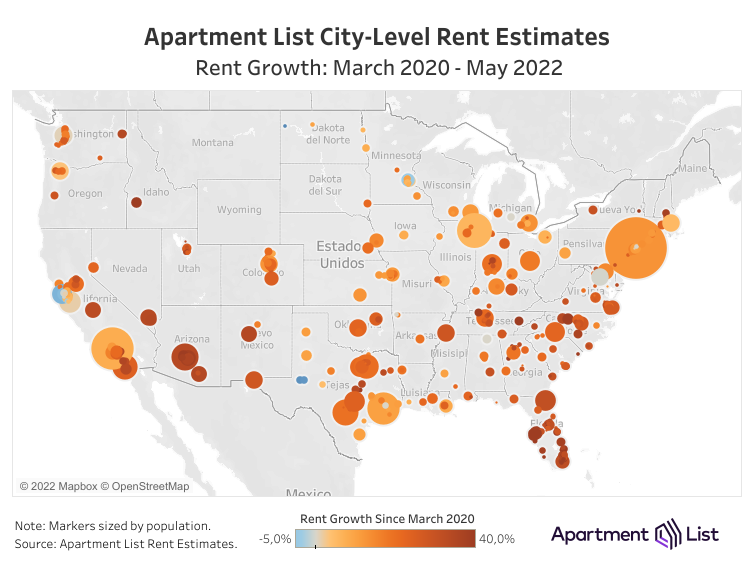
Major markets throughout the Sun Belt have experienced virtually-uninterrupted rent growth since the start of the pandemic, but over the past six months, some of the fastest growth has been occurring in pricey coastal markets. The following table shows the ten metropolitan areas that have experienced the fastest rent growth over the past six months, over the past year, and since the pandemic started in March 2020:
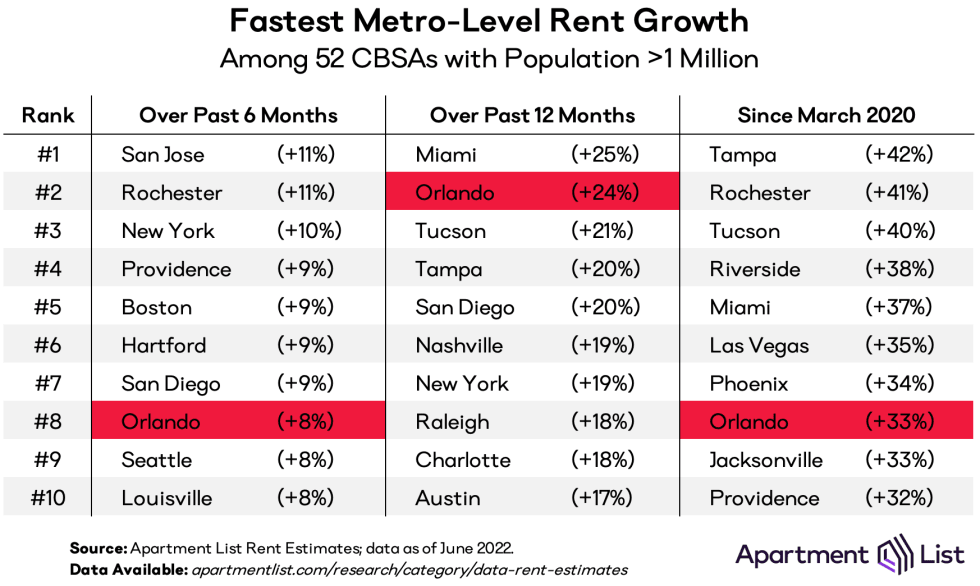
The rightmost column shows that most of the markets that have experienced the fastest growth over the course of the pandemic are located in the Sun Belt, with Florida and Arizona accounting for six of the top ten. However, Orlando is the only one of these markets that appears in all three columns, while many of the others have seen growth cooling. The Tampa metro has had the fastest rent growth over the course of the pandemic as a whole, with a staggering 42 percent increase. However, growth in Tampa has cooled down in recent months, with a more modest 4.8 percent increase since last December, which is actually slower than the national average. As we see below, other fast-growing metros have experienced even sharper cooldowns in recent months.
On the other hand, the six month column shows that some markets which had seen sharp declines at the start of the pandemic are now heating up. The San Jose metro has seen the nation’s fastest rent growth over the past six months, and the area recently surpassed its March 2020 level, leaving neighboring San Francisco as the only metro where rents are still cheaper than pre-pandemic. Similarly, the New York City, Boston, and Seattle metros are continuing strong rebounds. This list also includes two smaller markets in the Northeast – Hartford, CT and Providence, RI. As hybrid remote work continues to take hold, more affordable mid-sized markets such as these may emerge as attractive alternatives for those who only need to commute occasionally. Hartford, for example, is roughly a two hour drive from both New York City and Boston.
Only the San Francisco Bay Area still lags pre-pandemic rent levels (barely)
Despite heating up recently, the San Jose and Seattle metros have still had some of the most modest rent growth over the course of the pandemic as a whole. Similarly pricey coastal metros including San Francisco; Washington, D.C.; and Los Angeles also appear in the rightmost column of the table below, in addition to Midwest metros where growth has consistently been sluggish compared to the national average.
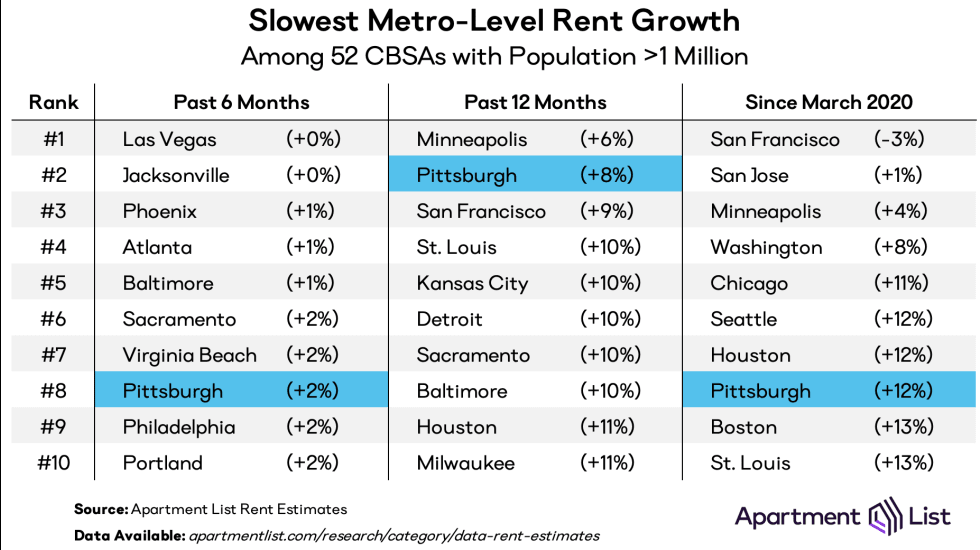
As mentioned above, the San Francisco metro is now the only region where the median rent is still below its pre-pandemic level, but that discount is currently just 1 percent. The Houston metro is the only one which appears in all three columns. Minneapolis has seen the slowest rent growth over the past year, but its 5 percent increase would have been considered substantial in a typical pre-pandemic year. Notably three of the metros that have seen the slowest growth over the past six months – Phoenix, Las Vegas, and Jacksonville – are among the 10 fastest growing markets over the course of the pandemic as a whole. After booming consistently for two years, these markets are finally showing signs of plateauing.
Conclusion
With a 1.3 percent increase in May, rent growth is continuing to pace ahead of pre-pandemic trends, even as it cools substantially from last summer’s peak. While the apartment market has shown some signs of easing, our 5 percent vacancy index remains well below the pre-pandemic norm, and increased pressure in the for-sale market could translate to the rental market as well. The summer months are likely to bring continued rent growth through the rental market’s busy season. Despite a recent cool-down, many American renters are likely to remain burdened throughout 2022 by historically high housing costs.
To learn more about the data behind this article and what Apartment List has to offer, visit https://www.apartmentlist.com/.


Sign up to receive our stories in your inbox.
Data is changing the speed of business. Investors, Corporations, and Governments are buying new, differentiated data to gain visibility make better decisions. Don't fall behind. Let us help.


Sign up to receive our stories in your inbox.
Data is changing the speed of business. Investors, Corporations, and Governments are buying new, differentiated data to gain visibility make better decisions. Don't fall behind. Let us help.