
Single-Family Investor Activity Bounces Back in the First Quarter of 2022
An increase in the level of investor purchases in Q1 is a strong signal that last year’s investor surge might be the new normal
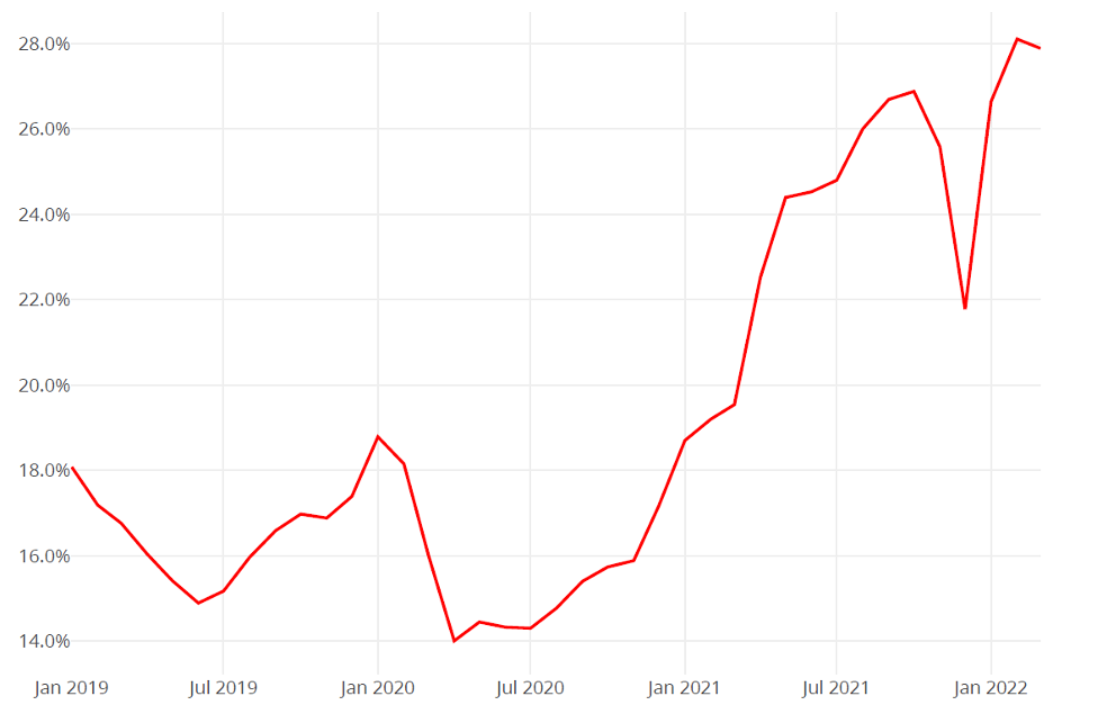
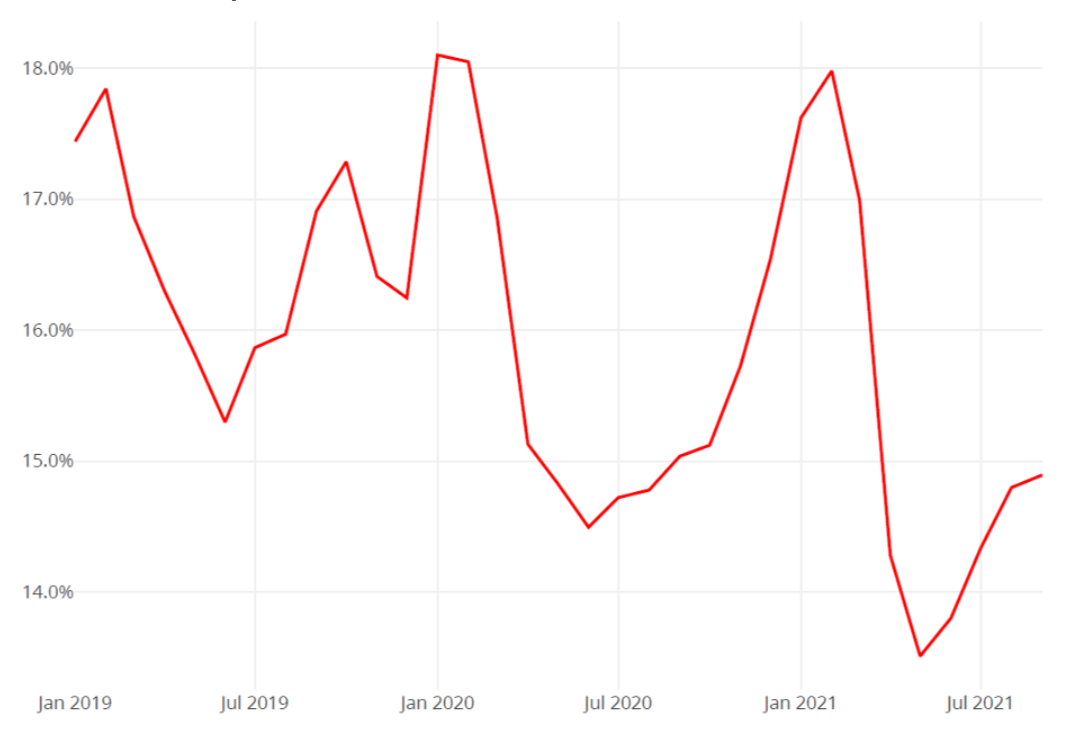
Although the real estate market showed signs of receding in Q4 2021, investors resumed their buying spree in early 2022. Investors made 28.1% of all single-family purchases in February, a record high according to CoreLogic’s data that goes back to 2011. March registered similarly high figures, with an investor share of 27.9%. Figure 1 depicts this bounce back in investor interest with investor share of home purchases rising nearly 5 percentage points from December (21.8%) to January (26.6%).
Figure 1: Share of Home Purchases Made by Investors by Month, Jan 2019 – Mar 2021
The current level of investor purchases is the clearest sign yet that investors may have changed their behavior permanently. Figure 2 shows the number of purchases nationally made by investors along with the number of purchases made by non-investors. Both lines show an upswing in March. While this is normal for owner-occupied purchases, it is not commonplace for investors. Prior to 2021, investors did not display strong seasonal patterns, but the increase in spring purchasing activity over the past two years indicates that investors may once again ramp up their purchases in the warmer summer months. However, there are other plausible explanations for this seasonal uptick. Interest rates began increasing in March, so investors may have splurged to lock in a good rate. Similarly, stock prices were declining throughout the first quarter so investors may have seen the single-family property market as an attractive alternative investment.
Figure 2: Monthly Home Purchases Made by Investors and Non-Investors, Jan 2019 – Mar 2022
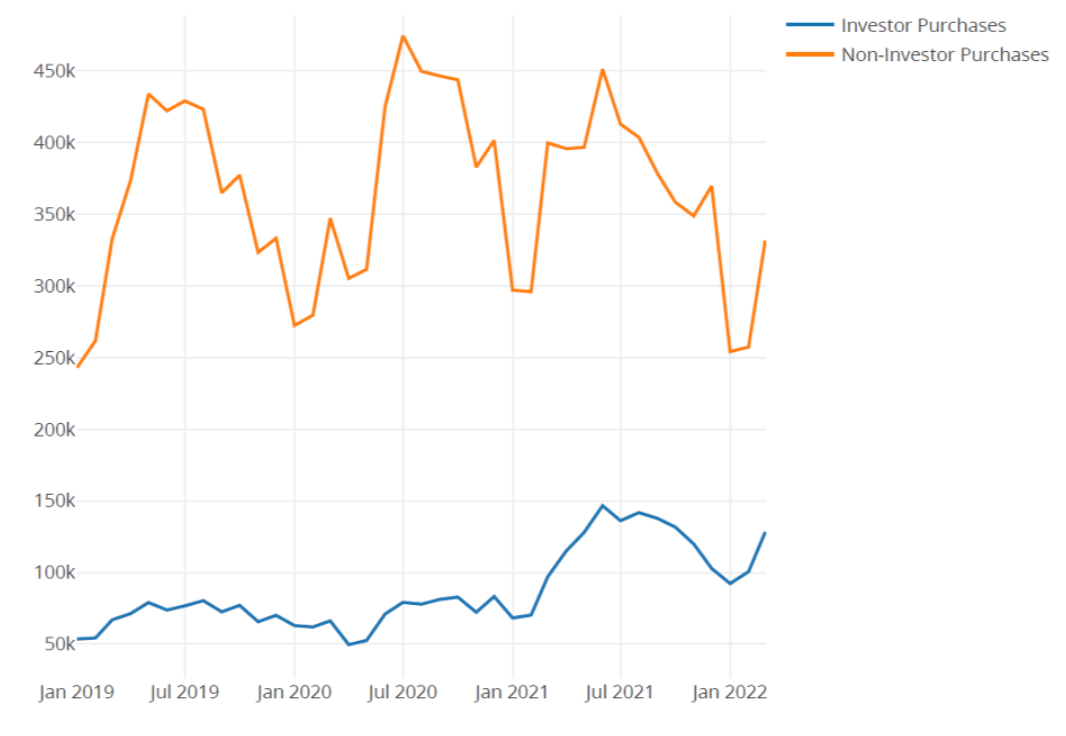
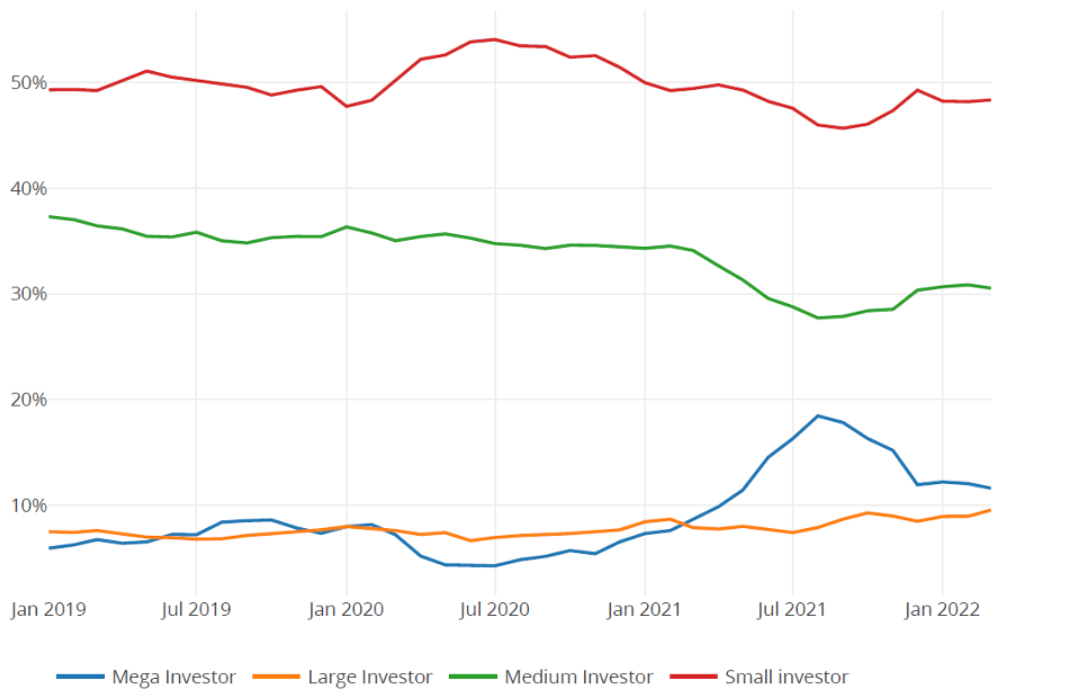
Figure 3 shows different investor classes have maintained their shares through Q1 2022. Small investors (those who own fewer than 10 properties) were responsible for nearly half (48%) of all investor purchases during the first quarter of the year. Medium investors (those with 11 – 100 properties) purchased 31% of investor properties, large investors (those with 101 – 1,000 properties) accounted for 9% of home purchases and mega investors (those with over 1,000 properties) represented 12% of all purchases.
Mega investors are the most likely cohort to move in and out of the market as the overall investor share fluctuates. As total investor share rose 6 percentage points from January to July 2021, the percentage of mega investors increased from 7% to 18%. It will not be surprising if this group increases its share of investment property purchases in Q2 2022.
**Figure 3: Share of Investor Purchases by Investor Size, Jan 2019 – Mar 2022
 **
**
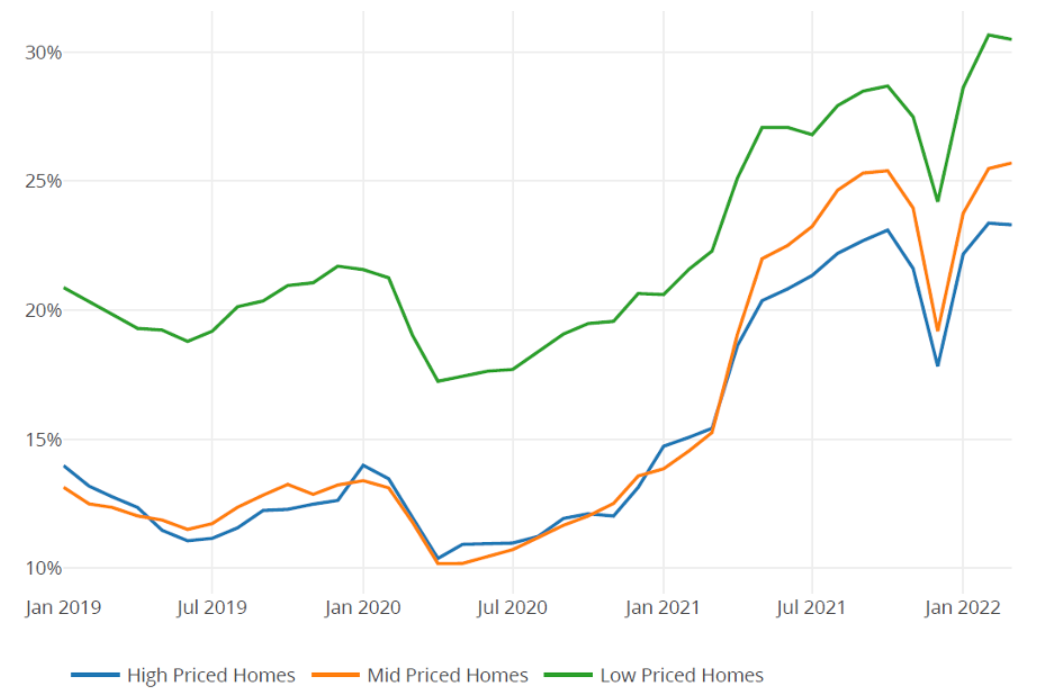
Investors’ preferred markets do not appear to have changed as activity rebounded. Figure 4 shows investor shares by MSA price tier. Investors clearly prefer to operate in cheaper areas of MSAs, as reflected in the investor purchase percentage in each of the three home price tiers. Approximately one-third of home purchases in the bottom tier of MSAs were made by investors, creating extra competition for most first-time home buyers who are looking in the same areas.
Figure 4: Investor Shares by Price Tier, Jan 2019 – Mar 2021
Most investors are buying to rent out the homes rather than to flip them. Figure 5 shows the share of homes purchased by investors that were resold within six months through September 2021. The graph shows that only 14.9% of homes purchased by investors in September had been resold by April, a 0.1% decline from September 2020 and a 2% decline from September 2019. Of course, flippers generally resell homes to owner-occupied buyers in the summer so this rate will likely increase over the next few months. However, there is little reason to believe sales figures will rise above historical norms.
Figure 5: Share of Investor Purchases Resold within Six Months, Jan 2019 – September 2021
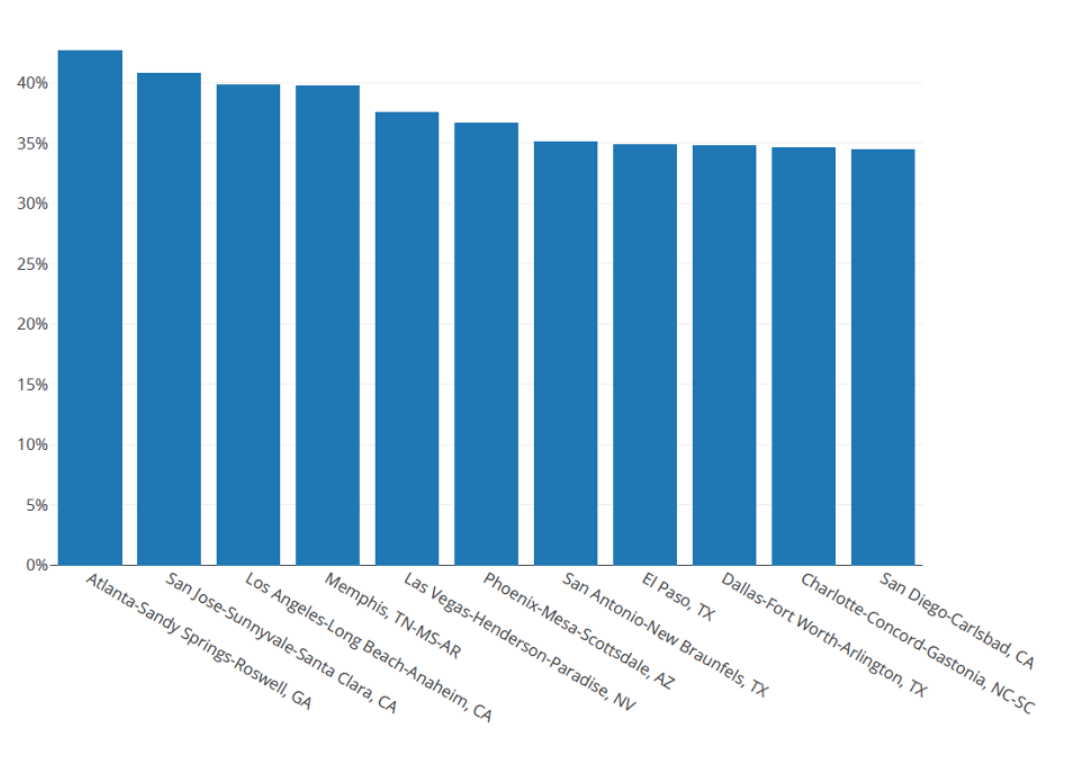
Investors focused most of their attention on warm weather states in Q1. The ten MSAs with the highest investor purchase shares are shown in Figure 6. Five of these are in the South and the other five are in the West — three of the MSAs with the top percentage of investors are in California. Investors appear attracted to locations with strong fundamentals such as high population and house price growth. The exception is the three California MSAs that are in a state saddled with high prices and population loss in recent years.
Figure 6: Highest 10 Investor Shares by MSA, Q1 2022
The big question that will be answered over the second and third quarters of this year is how investors will respond to increases in interest rates? It may be that investors, who are more likely to be cash buyers, will be less sensitive to these changes than owner-occupied buyers. However, there are good reasons to think the opposite. Unlike homeowners, for whom the purchase decision is often a lifestyle choice, investors are often choosing to invest in single family homes from a set of other potential investments, such as stocks and bonds. So, while rate increases could cause an investor to put their money in another asset class, traditional homebuyers might still make the decision to purchase a home, though it may be smaller or in a less expensive area that is within their decreased budget.
To learn more about the data behind this article and what CoreLogic has to offer, visit https://www.corelogic.com/.


Sign up to receive our stories in your inbox.
Data is changing the speed of business. Investors, Corporations, and Governments are buying new, differentiated data to gain visibility make better decisions. Don't fall behind. Let us help.


Sign up to receive our stories in your inbox.
Data is changing the speed of business. Investors, Corporations, and Governments are buying new, differentiated data to gain visibility make better decisions. Don't fall behind. Let us help.