
Source: Apartment List
Household composition refers to the group of individuals who live together in a household, and how they relate to one another. Historically, changes in household composition have been fairly gradual and reflect cultural and economic shifts that unfold over generations. But the household shifts that resulted from the COVID-19 pandemic were rapid, and have had a dramatic effect on housing affordability.
Census data show that the most dramatic shifts were driven by young adults who moved in with family during the early stages of the pandemic, and then subsequently moved out on their own. This led to an unprecedented contraction – and expansion – in the total number of households across the country. And while some housing arrangements are returning to their pre-pandemic levels, a sustained increase in the number of Americans living on their own has been a key driver of rapid price inflation that is currently dominating the housing market.
Gradual changes before the pandemic, rapid changes during the pandemic
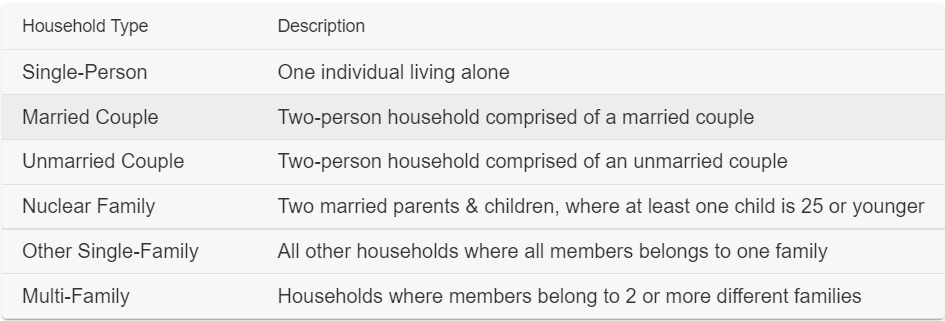
The Census Bureau’s Current Population Survey (CPS) contains annual and monthly data describing how members of each household relate to one another. For the purposes of our research, we use these data to define and track five specific household types.Household composition refers to the group of individuals who live together in a household, and how they relate to one another. Historically, changes in household composition have been fairly gradual and reflect cultural and economic shifts that unfold over generations. But the household shifts that resulted from the COVID-19 pandemic were rapid, and have had a dramatic effect on housing affordability.
Census data show that the most dramatic shifts were driven by young adults who moved in with family during the early stages of the pandemic, and then subsequently moved out on their own. This led to an unprecedented contraction – and expansion – in the total number of households across the country. And while some housing arrangements are returning to their pre-pandemic levels, a sustained increase in the number of Americans living on their own has been a key driver of rapid price inflation that is currently dominating the housing market.
Gradual changes before the pandemic, rapid changes during the pandemic
The Census Bureau’s Current Population Survey (CPS) contains annual and monthly data describing how members of each household relate to one another. For the purposes of our research, we use these data to define and track five specific household types.
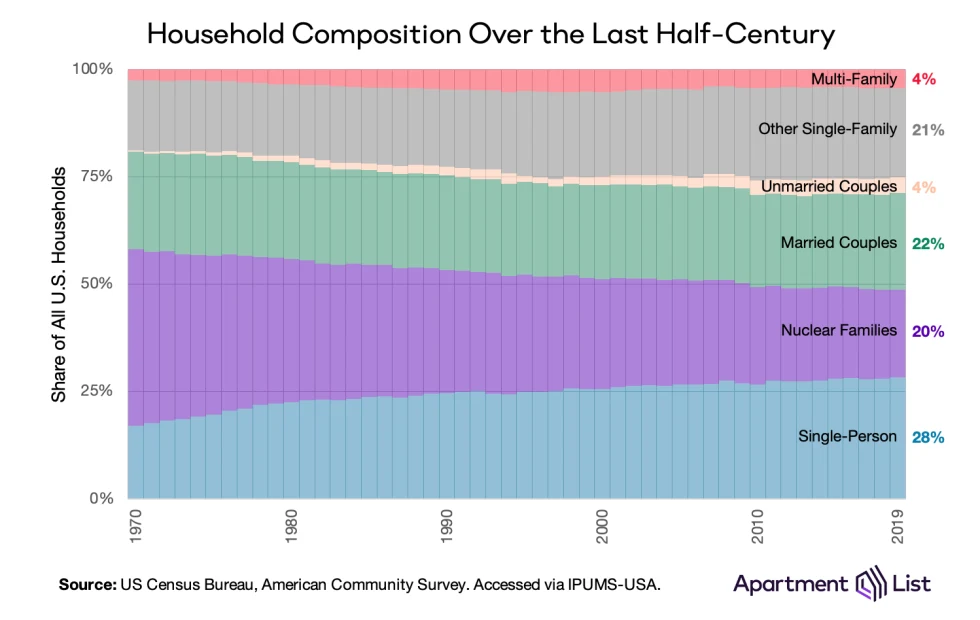
In Reconfiguring the American Household, our team analyzed decades of CPS data to understand the gradual evolution of household types from 1970 to 2019. For example, the nuclear family – two married parents, their children, and no one else – was once the dominant household arrangement, accounting for 41 percent of all households across the country in 1970. But as Americans began marrying later and having fewer children, the nuclear family became significantly less common; by 2019 it accounted for just 20 percent of households. Today it is more likely for a household to be a single person living alone (28 percent) or a couple living together without children (26 percent). Meanwhile, multi-family households, including the traditional roommate household where no members are related by blood or marriage, remain relatively rare but have become more common over time.
Significant changes in household composition normally take decades to play out, but in 2020 these gradual movements were supplanted by abrupt shifts. The pandemic caused many Americans to rethink their current living arrangements. As unemployment spiked to nearly 15 percent, many struggled to afford their regular housing expenses. As jobs and schools went remote, many felt that they lacked adequate space for themselves and their families to operate comfortably from home. As proximity to others became a health risk, many left close-quarter living arrangements and high-density cities. What transpired is a series of rapid changes in household formation and composition. Below we highlight five of these changes and the impact they have on housing affordability.
1. Two and one half million households disappeared (and then reappeared)
One immediate outcome of the pandemic was rapid household consolidation. Monthly CPS data show that over 2.5 million households disappeared in early 2020, as the national total fell from 130.3 million to 127.6 million. This was predominantly driven by younger adults who had been living alone or with roommates, deciding to temporarily give up their independent living arrangements to move in with family.
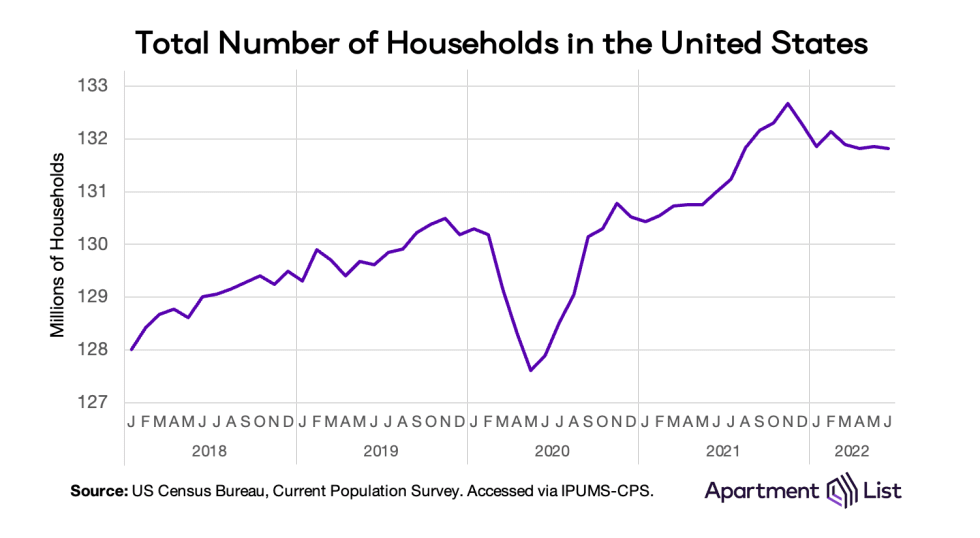
Historically, household growth is responsive to the broader economy, decelerating during recessions as workers cut down on housing costs by consolidating into fewer households. But none of the recessions occurring in the past half-decade impacted household growth as dramatically as the coronavirus pandemic. Annual household growth has been positive every year since 1970, and even if we zoom in on shorter time periods, the only substantial household contraction took place was during the depths of the Great Recession, when the nation lost one million households (0.9 percent of total) in a six-month period from late-2009 to early-2010. Household losses were more than double that during the first six months of COVID. Two percent of all households disappeared, wiping out nearly three years of household growth and leaving the United States with roughly the same number of households in June 2020 as it had in June 2017.
The shock was short-lived, however, as the 2.5 million households lost in 2020 re-formed by the end of the year and an additional two million formed throughout 2021. Even more recently, the number of households has again contracted slightly, likely in response to skyrocketing housing costs. As of June 2022, the United States contains 131.8 million unique households, down slightly from an all-time high just seven months earlier.
2. Single-person households were largely responsible for rapid shifts
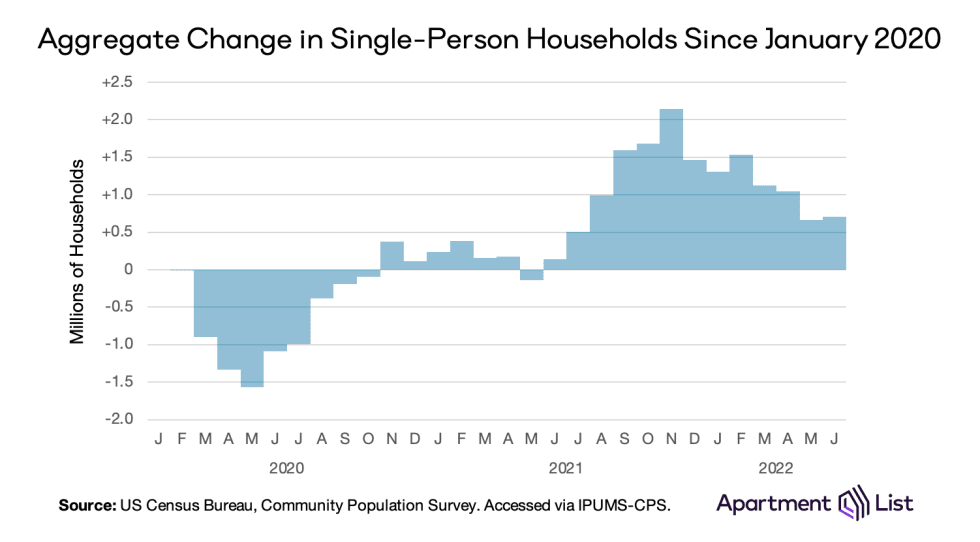
Single-person households have the greatest impact on top-line household growth. Individuals who live alone have greater flexibility and are highly mobile by nature, and as soon as they move in with others, a net household is lost. (Conversely, any time one moves out of shared living arrangements to live alone, a net new household is created.) Single-person households accounted for 61 percent of the 2.5 million households that dissolved in early 2020, and 82 percent of the 4.5 million households that formed thereafter. Despite the need to socially distance, high unemployment and economic uncertainty appears to have discouraged people from living alone at the start of the pandemic. But that quickly changed. Today there are nearly 38 million people living alone across the country, representing 29 percent of all households.
Younger adults are less likely to live alone than older ones, but throughout the pandemic they had an outsize impact on the formation (and dissolution) of these single-person households. In 2019, just 3 percent of Gen Z adults lived on their own, compared to 9 percent of Millennials, 10 percent of Gen Xers, 20 percent of Baby Boomers, and 34 percent of Silents.1 But in the first half of 2020, 33 percent of those Gen Z single-person households disappeared, compared to just 2 percent of those belonging to older generations. Nearly 400,000 Gen Zers stopped living on their own, but as we know, the pendulum swung back quickly and nearly 1 million new Gen Z adults were living alone by the end of 2021.
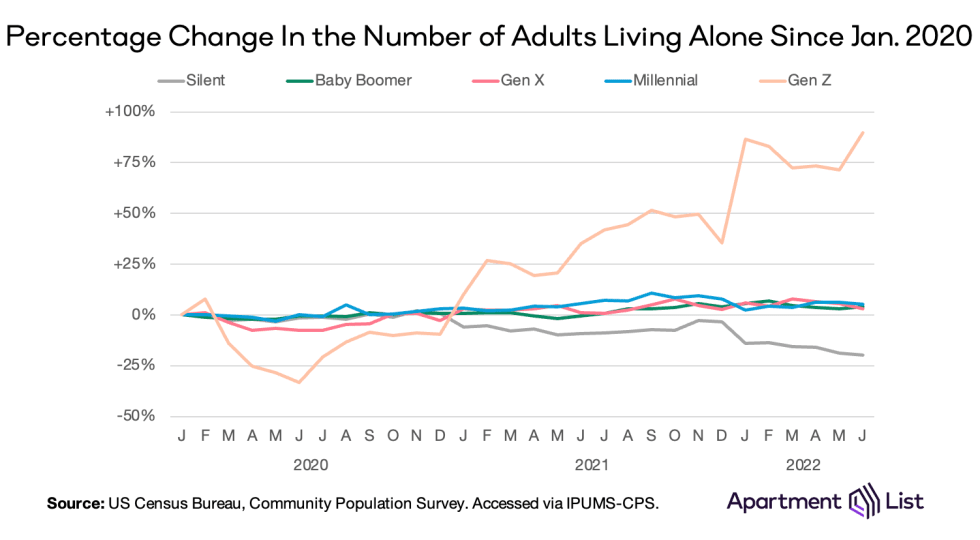
Among older generations, this trend was much more muted, with one notable exception. Gen X – the parents of Gen Z – saw a 7 percent drop in the number of single-person households. But in this case, the data suggest Gen Xers were not moving but rather taking in children and younger family members, converting their single-person households into single-family households. Below we highlight a handful of synchronous trends that illustrate how the pandemic reunited families (albeit briefly).
3. Young adults moved back in with parents and re-formed nuclear households
As mentioned earlier, nuclear family households have been steadily declining for at least 50 years. There were the same number in 2019 as there were in the mid-1980s, when the U.S. population was nearly 30 percent smaller. But for a brief period in 2020, we observed a resurgence of nearly 1 million new nuclear family households as young adults living away from home moved back in with parents. The Pew Research Center found that in June 2020, a record number of young adults were “disconnected” – neither employed nor in school. At the same time, our analysis finds that over 75 percent of Gen Z adults over the age of 18 were living with a parent, a jump of nearly 10 percentage points compared to pre-pandemic.
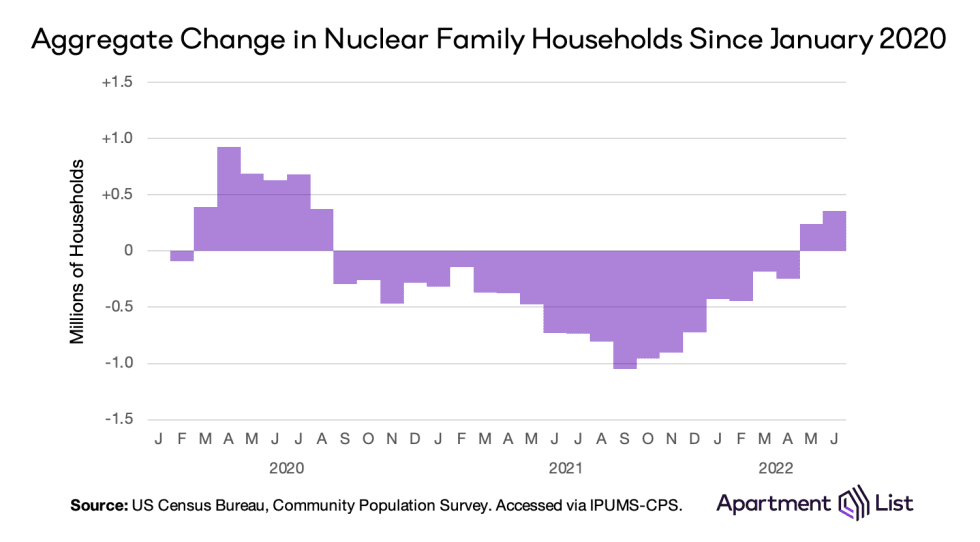
We actually see nuclear family formation taking place across four generations. Over 2 million Gen Z adults and 1 million Millennials started cohabitating with parents in early 2020. Meanwhile, 1.5 million Gen Xers and a half-million Baby Boomers began cohabitating with their children. For this stretch of the pandemic, the nuclear family was the only household type growing in popularity, even as the nation’s total household volume declined.
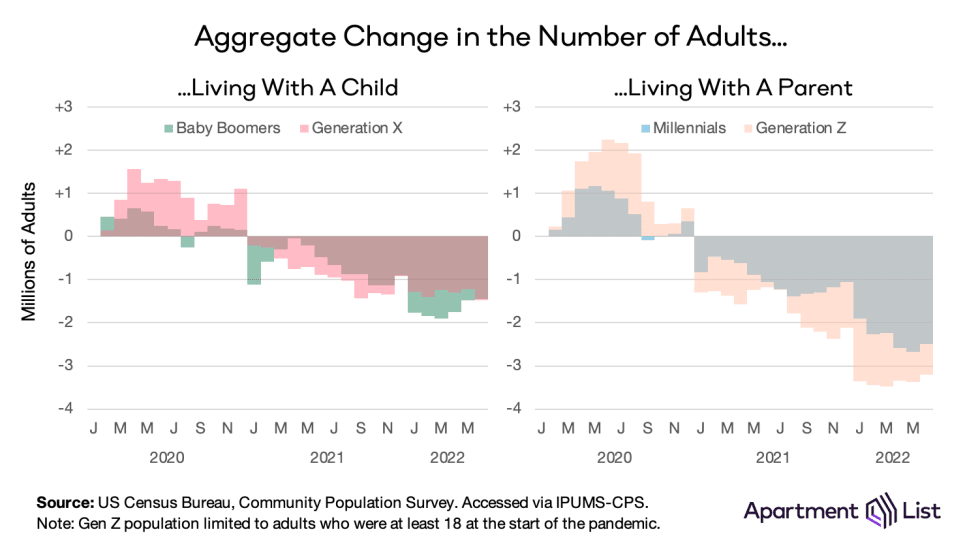
But like many early-pandemic trends, this one was short-lived and the nuclear family fell back out of fashion throughout 2021. Younger generations decoupled from older ones, with many moving out to live independently and form their own households. But over the last eight months the number of nuclear families has been rising once again, and just recently eclipsed pre-pandemic levels.
**
4. Young adults are also forming nuclear households of their own**
Without much else to do in the midst of a pandemic, many unmarried, cohabitating couples decided to get married. 2020 saw a jump in married couple households that mirrors a drop in unmarried couple households. 2021 saw a half-million increase in both household types, followed by a decrease in 2022. These trends fit nicely within the context of nuclear family changes described above.
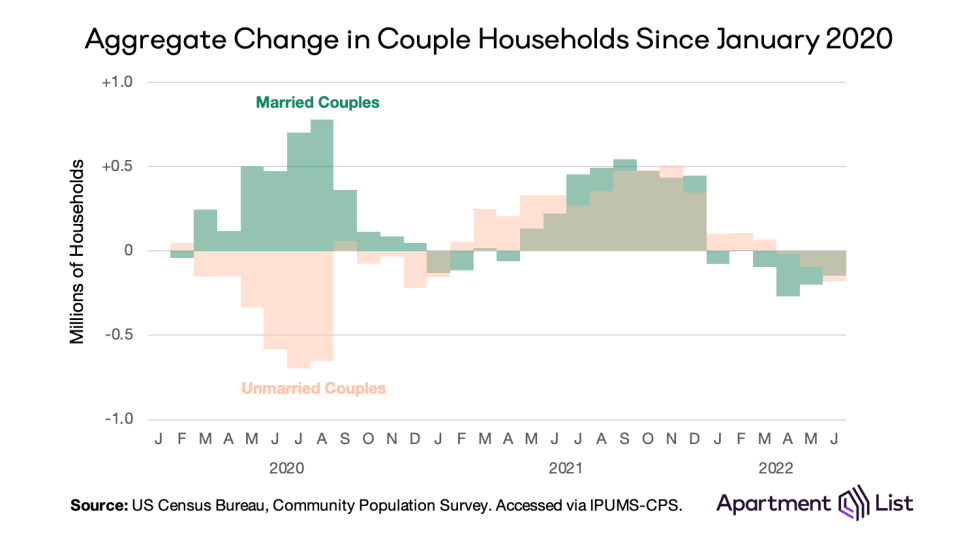
In 2021, a large number of nuclear family households would convert to married couple households when the child(ren) in that family moved out on their own. In 2022, the number of nuclear families is rising again, but not because of younger generations moving back in with older ones. Instead, it appears to be those younger generations starting nuclear families of their own. Provisional data from the CDC shows that the national birth rate is increasing for the first time in nearly a decade.
5. Roommate households broke apart and have yet to recover
We define a roommate household as two or more housemates who are all unrelated to one another; it is the classic living arrangement for many young adults. It is also popular in cities where housing costs are higher and where there is a concentration of young, unmarried, and childless residents. But for many, the pandemic diminished the appeal of living with roommates. Urban amenities were suspended, sharing space with non-family members was discouraged, and remote work pushed some young professionals into close physical quarters with their housemates. In 2020 more than one-half million roommate households disbanded, and despite a slight recovery, the number remains below pre-pandemic levels even as the total number of households reaches an all-time high.
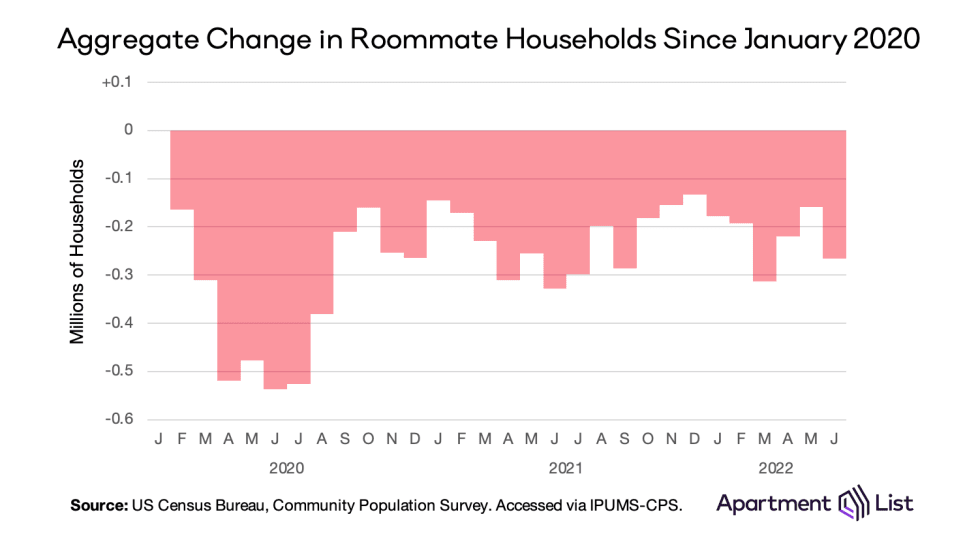
Once again, younger generations are responsible for this shift, particularly Millennials and Gen Zers who made up nearly 75 percent of all roommate household members at the start of the pandemic. The share of Gen Z adults who lived in a roommate household fell from 6.6% in January 2020 to just 2.8% in July (a net change of -700,000 people). Another 700,000 Millennials also separated from roommate households during this time. Similar to young single-person households, it is plausible that a large share of these young roommates moved in with family to wait out the worst of the pandemic, contributing to the massive household losses that took place in 2020.
Household trends have made housing markets increasingly unaffordable
Household volume is a proxy for housing demand. When 2.5 million households evaporated in 2020, 2.5 million fewer homes were in demand. But when 4 million households suddenly reappeared, some markets went from over-supplied to under-supplied in a matter of months. Ultimately, dramatic shifts in household volume led to equally dramatic shifts in price.
This is especially true in the rental market, where a majority of household formation took place. Free of mortgages, renters had the most flexibility to leave households in 2020 and form new ones in 2021. In fact, monthly CPS data show that early in the pandemic, renter household losses exceeded total household losses, meaning there was actually a net increase in homeowner households. The 2.5 million household drop is net of 5 million renter households dissolving and 2.5 million homeowner households forming. We know there were millions of renters who gave up their leases to move in with family, but there were many others who stopped renting to because homeowners during the buying spree that dominated the for-sale market in 2020.
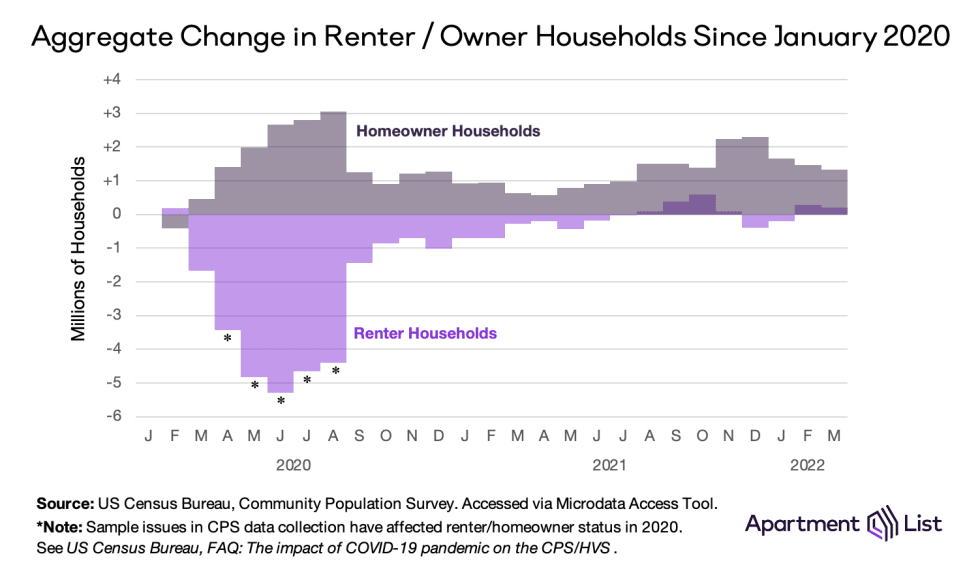
Here it is important to acknowledge that the pandemic caused issues with the collection of the CPS data that we rely on for this analysis. In 2020 the Census Bureau suspended all in-person interviews, relying solely on phone interviews to reach households. This changed the composition of households that were included in the survey sample because some groups – including homeowners – were more likely to be reachable by phone. This response bias means the CPS data overstates the homeownership rate during the months that in-person interviews were suspended. Subsequent research has found that the homeownership rate increased in 2020 even if you properly control for this bias, but nevertheless the drop in renter households presented is, to some extent, an overstatement.
Despite the uncertainty in true homeowner/renter losses, there are plenty of external signals that support the notion that apartment demand decreased sharply in 2020, increased sharply in 2021, and tapered in 2022. When renter households dissolved, some of the nation’s densest and most expensive cities saw rents fall as much as 25 percent. When renter households re-formed and apartment demand rebounded, vacancies fell and prices surged. This year, as household growth has decelerated, so too has rent growth.
Housing affordability had been a growing concern before the pandemic, and this recent household growth has thrown fuel on the fire. Rent changes measured by our National Rent Growth Index responded almost immediately to the household changes captured in CPS data. Prices hell when renters left the market but as annual household growth rocketed past 10 percent, rent inflation followed suit, peaking above 15 percent just a few months later.
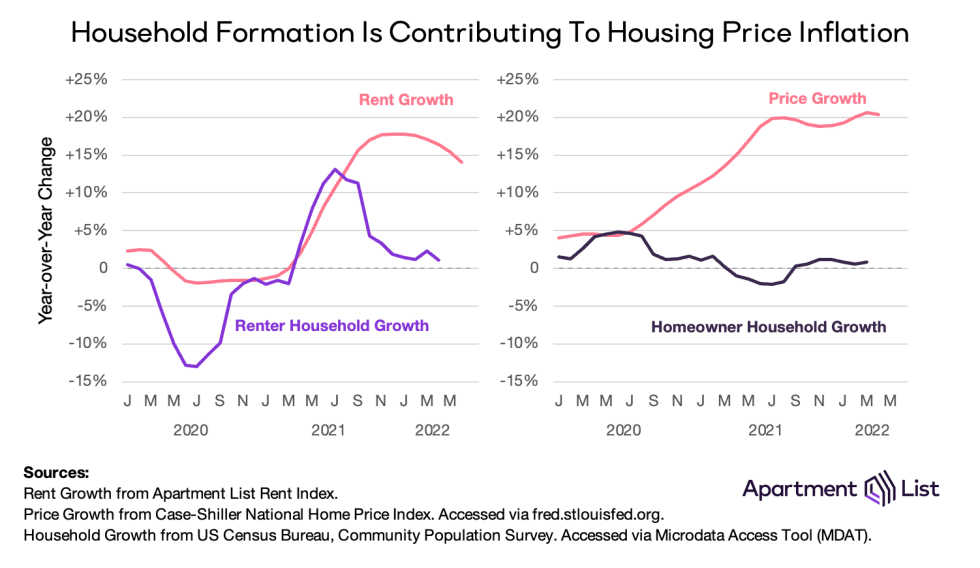
It is a similar story in the for-sale market, except price increases happened sooner and faster than they did in the rental market. Homeowner household growth has not been as dramatic, but record-low inventory persisted for two full years, sending prices skyrocketing. For potential homebuyers, high demand met low inventory early in the pandemic and did not relent for nearly two years. According to the Case-Shiller Index, which uses a similar methodology to our Rent Index but for home sales instead of rentals, prices today are up more than 20 percent year-over-year.
2022 has delivered a bit of relief from unrelenting price growth, but renters and home buyers continue to fight an uphill battle against affordability. Rent growth is slowing but remains elevated above pre-pandemic years. Meanwhile rising mortgage rates mean that the cost of buying a home continues to rise even as inventory improves and list prices fall. Housing unaffordability has become a key contributor to economic inflation and is now a central topic in national political discourse.
To learn more about the data behind this article and what Apartment List has to offer, visit https://www.apartmentlist.com/.


Sign up to receive our stories in your inbox.
Data is changing the speed of business. Investors, Corporations, and Governments are buying new, differentiated data to gain visibility make better decisions. Don't fall behind. Let us help.


Sign up to receive our stories in your inbox.
Data is changing the speed of business. Investors, Corporations, and Governments are buying new, differentiated data to gain visibility make better decisions. Don't fall behind. Let us help.


