Multifamily rent growth has garnered plenty of attention over the last 12 or 18 months. For the majority of that time, the focus was on the unprecedented rate of the growth – at least in the modern era. Over the last month or so some of the conversation has shifted to discussing a slowdown in growth. The aim of this month’s newsletter will be to add some additional clarity and context to the discussion.
As usual, numbers will refer to conventional properties of at least 50 units.
National New Supply and Net Absorption
The major factor impacting rent growth since the start of last year has been a supply/demand imbalance. In 2021 alone, net absorbed units outpaced new supply by around 280,000 units. Even after lackluster apartment demand this year, the net supply deficit when taking all of 2021 and 2022 through July together remained at about 200,000 units. This means that more than halfway through a year with the weakest net absorption in recent memory, less than 30% of last year’s excess occupancy has been eroded.
With the traditionally weaker fourth quarter still ahead for the industry and based on projected deliveries through the end of the year, average occupancy is likely to finish 2022 at around 93% – higher than in 2018, 2019, or 2020.
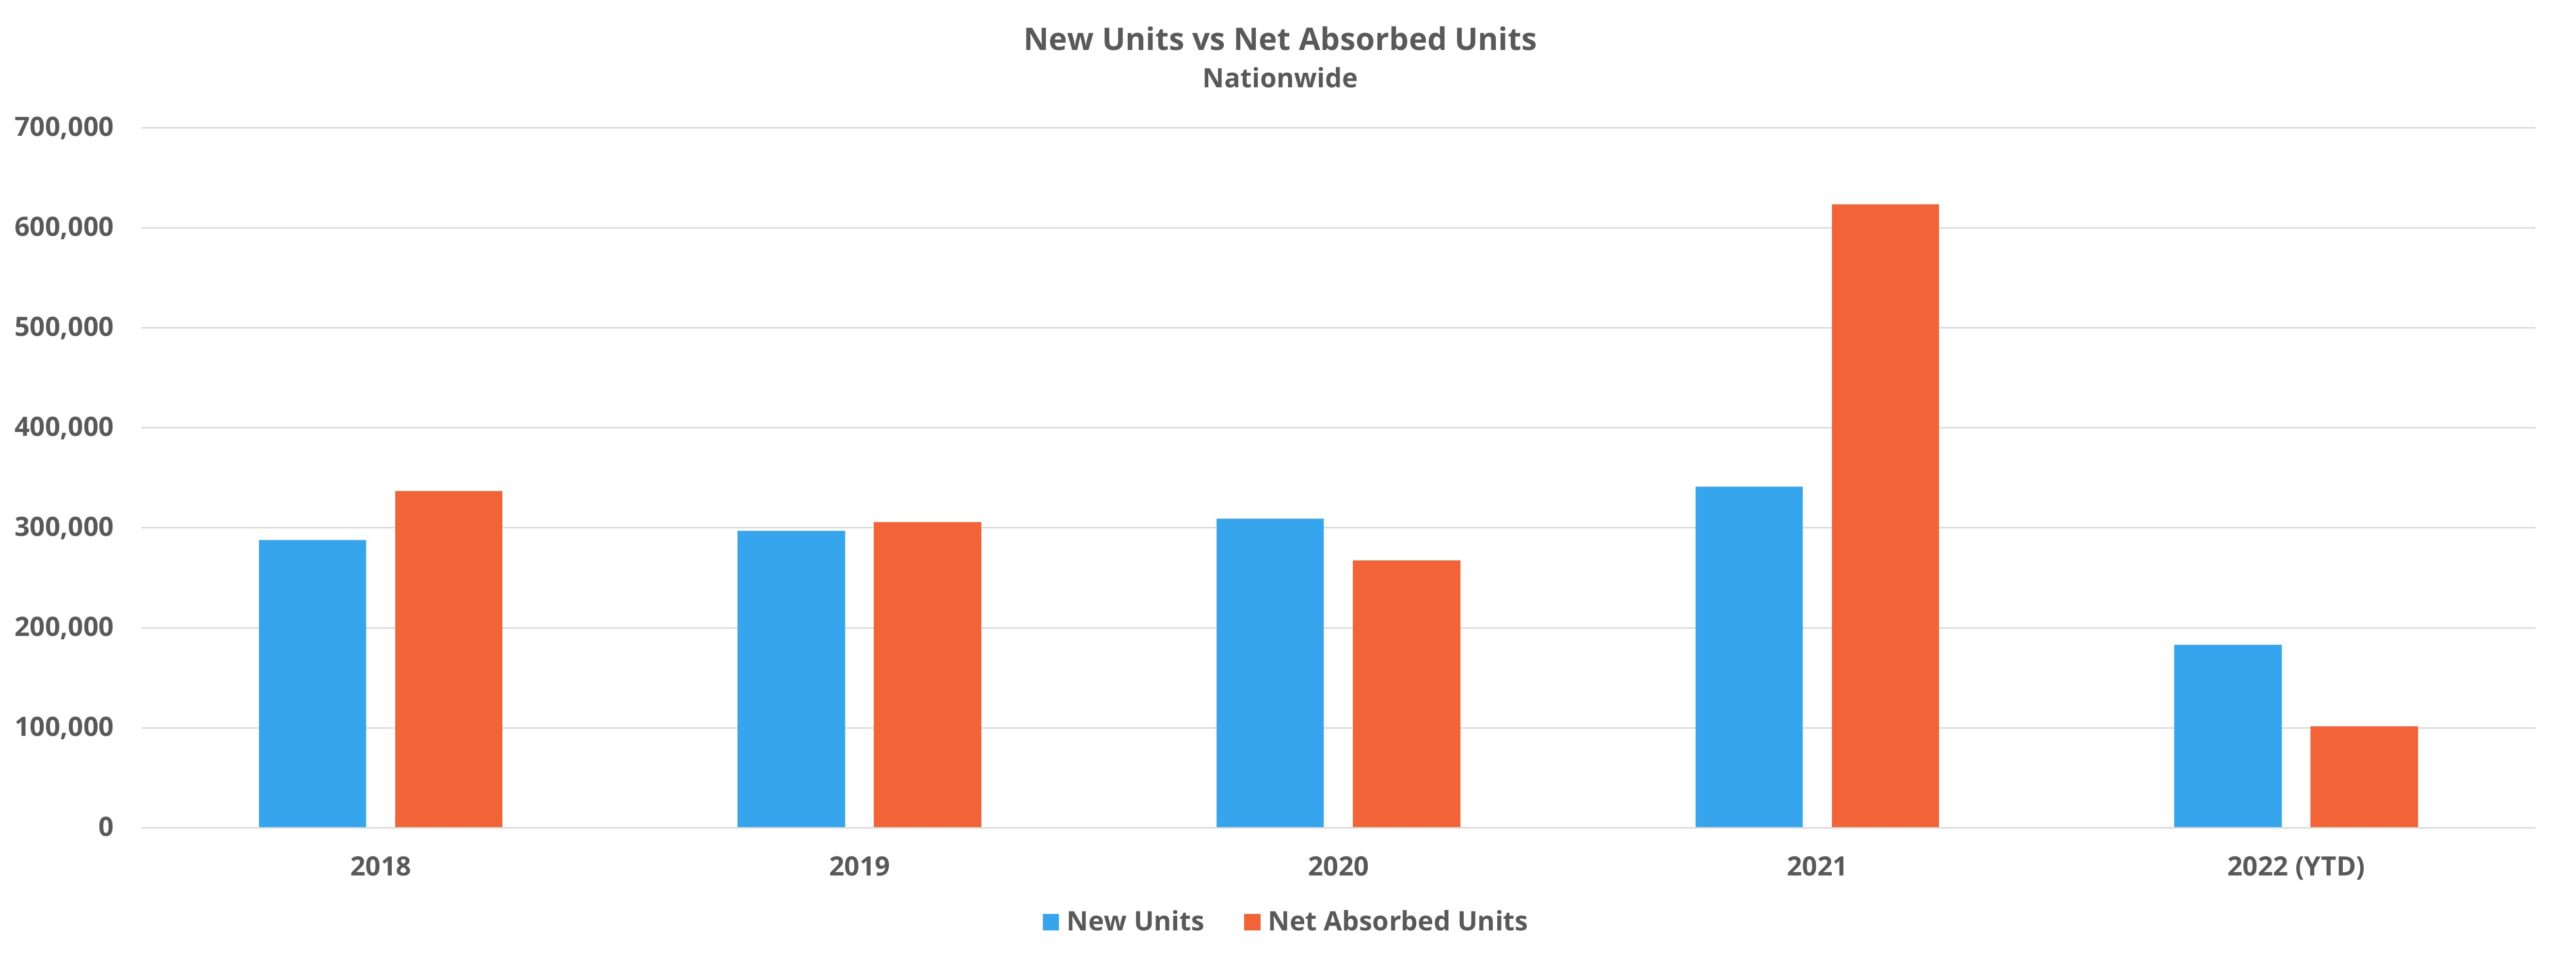
About 180,000 new units delivered through July was fewer than last year, but roughly at the three-year average from 2018 through 2020. A 0.7% reduction in national average occupancy so far this year was therefore not thanks to an increase in deliveries but to the collapse of realized apartment demand.
Net absorption has been 75% lower this year than last and the lowest in more than five years – including 2020. Dramatically lower net absorption has not been a concentrated phenomenon. All four ALN market tiers, categories based on market size, have underperformed both last year and even 2020. All four price classes have underperformed during the last year, though only Class C and Class D have failed to reach the 2020 net absorption total through July. Class D properties have shed more than 9,000 net leased units this year.
National Rent Growth
To start with, when did the post-COVID rent growth begin and what has been the scale of the growth? It can be difficult to keep track when variously reported as year-to-date, year-over-year, monthly rent change, et cetera. At the national level, average effective rent growth for new leases began in earnest in March of 2021. That was the first month since the early summer of 2019 with monthly average rent growth above 0.5%. In the 17 months from March 2021 through July 2022, national average effective rent rose by 22%.
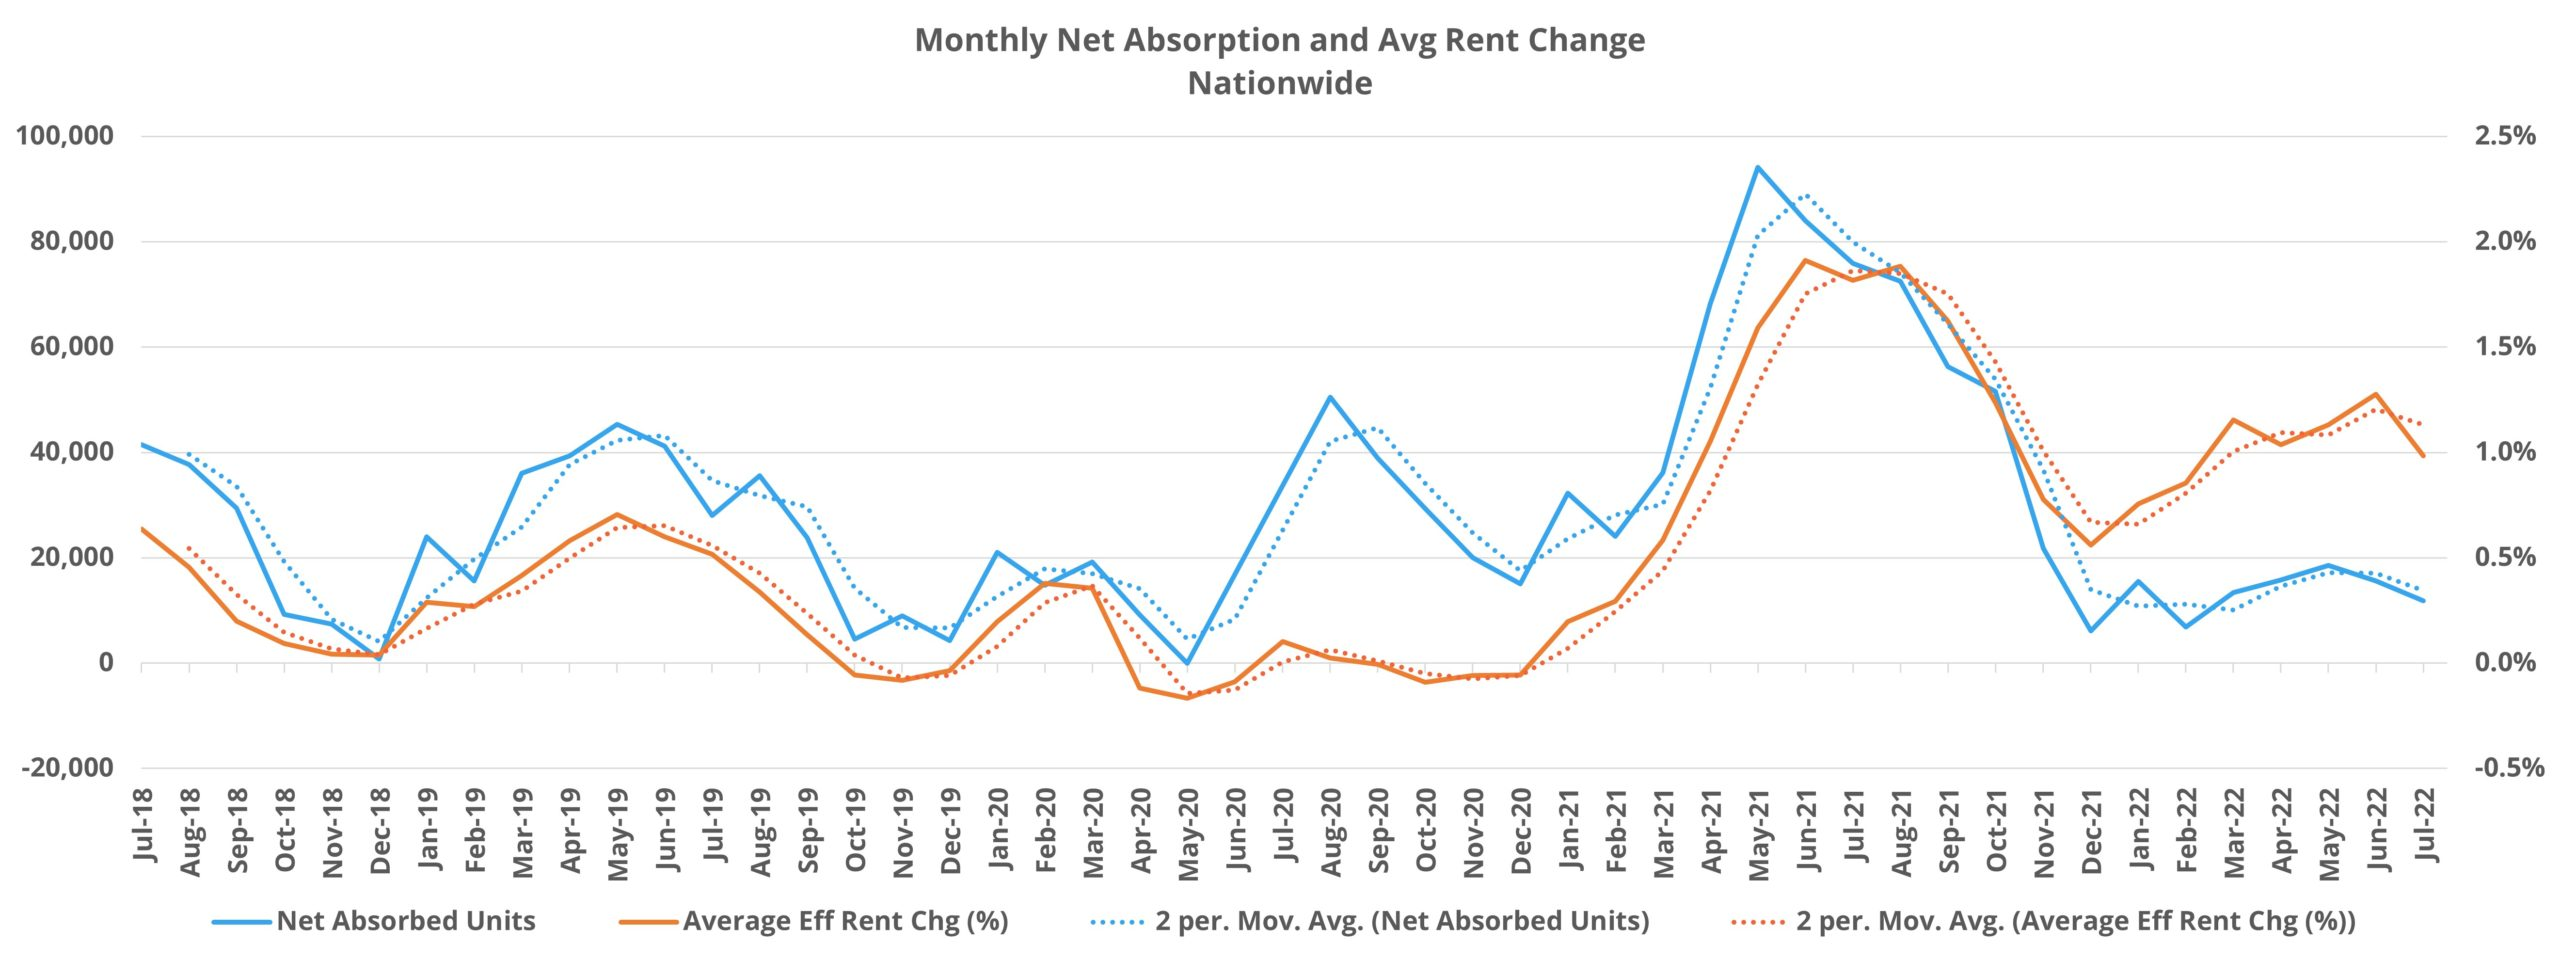
As with this year’s demand slump, the unusually high growth in average rent has been ubiquitous across markets, market tiers, and price classes. The growth has also been consistent over time. Since the 0.6% gain in March 2021, no month has failed to exceed 0.5% growth, and only four of the 17 months in that period failed to reach a 1% monthly increase. Those four months were in the seasonally weak part of the calendar for multifamily – November through February.
To recap, national rent growth began its time at unusual heights in the Spring of 2021 and has continued for nearly 18 months. The appreciation has been widespread and consistent. But as already mentioned, the conversation has begun to shift in the last month or two.
Shifting Rent Growth Trend
One significant decline in the rate of rent growth has already occurred, and it occurred last year. In June, July, and August of 2021 monthly average effective rent growth for new leases was 1.9%, 1.8%, and 1.9% respectively. In the time since, the monthly average gain has been 1%.
A subsequent major decline has yet to materialize, and another will need to emerge for the sector to regain some balance and to help take some momentum out of various ‘rent stabilization’ efforts being pursued by governments across the country. However, there have been some early indications of a change in trajectory.
Looking at successive three-month averages for monthly rent growth brings some clarity. Average monthly rent growth for May through July of this year was 1.1%. For that same period last year, the average monthly appreciation was 1.6%. Similarly, even though the 1.1% gain outpaced the previous three-month (February through April) increase of 1%, the takeaway should be that rent growth was essentially unchanged from a seasonally weak part of the calendar to one of the strongest sections on the calendar.
It is possible that August monthly rent growth will fall short of the 1% mark. That would be another data point reflecting softening relative to the recent trend during what is typically the strongest part of the year for multifamily.
Just on the basis of seasonality, the expectation for the upcoming fall and winter months would be for rent growth to continue to slow. It is also very possible that monthly rent growth will fall below 0.5% and maybe even turn slightly negative during the winter months – again, based just on seasonal trends. Add to that the rent growth of the past 18 months, persistent inflation, recession fears, and nine months and counting of underwhelming net absorption and it can be difficult to see unusually elevated rent growth surviving the next few months.
Takeaways
The rent growth of the last year and a half has been historic, consistent, and ubiquitous. Broader inflation, including rising costs of materials, labor, capital, insurance and more for operators has contributed to higher rents. So too has the unusually high gap between new leases and annual renewals.
Even so, the primary cause has been that nationwide net absorbed units has outpaced new supply by about 200,000 units since the start of 2021. This supply/demand imbalance sent average occupancy skyward and rent growth with it. Some of last year’s excess occupancy has been unwound this year, but the 0.7% decline through July has not yet offset the 2.4% gain from 2021.
However, the current 17-month streak of national average effective rent growth for new leases surpassing 0.5% will probably come to an end before the calendar turns to 2023. It is also possible that with so much up in the air geopolitically and macroeconomically an exogenous event occurs and shocks the system yet again – and if so, all bets are off.
It is unusual, but nevertheless true, that a further decline in both average occupancy and average effective rent growth would be a positive development for the industry. A return to a pre-pandemic norm for both average occupancy and average rent growth would do much to return some balance to an industry still feeling the repercussions of the 2020 and 2021 distortions.
Fundamentals remain strong, not least the developments on the for-sale side of the residential real estate sector. But, as we move toward next spring when apartment demand typically perks up after a winter slowdown, a major factor influencing rent growth levels will be to what extent average occupancy resembles a pre-pandemic level.
To learn more about the data behind this article and what ALN Apartment Data has to offer, visit https://alndata.com.


Sign up to receive our stories in your inbox.
Data is changing the speed of business. Investors, Corporations, and Governments are buying new, differentiated data to gain visibility make better decisions. Don't fall behind. Let us help.


Sign up to receive our stories in your inbox.
Data is changing the speed of business. Investors, Corporations, and Governments are buying new, differentiated data to gain visibility make better decisions. Don't fall behind. Let us help.