Recent trends in inflation and other macroeconomic factors have created interesting idiosyncrasies in company reported performance. One of the most interesting sectors has been department stores, where the interplay between full-line full price, clearance, and off-price has played out differently across the different companies in the space. In today’s Insight Flash, we look at overall industry and subindustry trends, average ticket, and ticket buckets to understand how spend has shifted in the Department Store space.
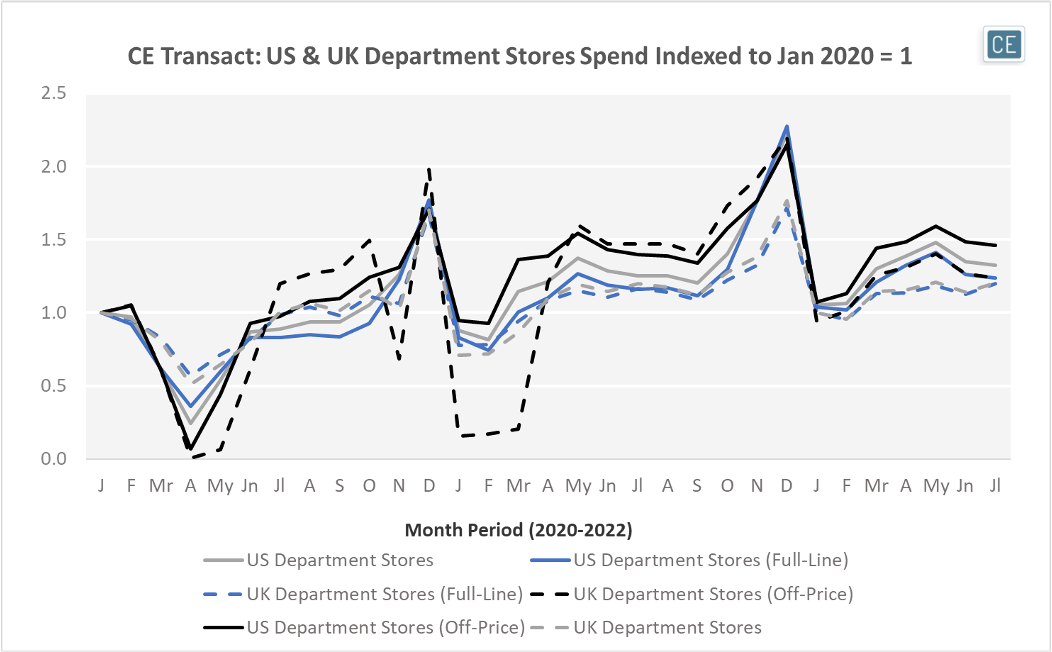
In the US and UK, the off-price segment has outperformed full-line stores in recent months. In the US, off-price spend in the last three months has been roughly 1.5x January 2020 levels, and 1.2x higher than full-line stores. In the UK, off-price spend was as high as 1.4x January 2020 level in May and 1.25x January 2020 levels in June and July. This translated to about 1.2x full-line levels in May, but has since come close to parity with full-line levels in July. More generally, US Department Store Spend at the industry level and for each of the Off-Price and Full-Line subindustries has outperformed spend in the UK versus January 2020.
Department Store Spend
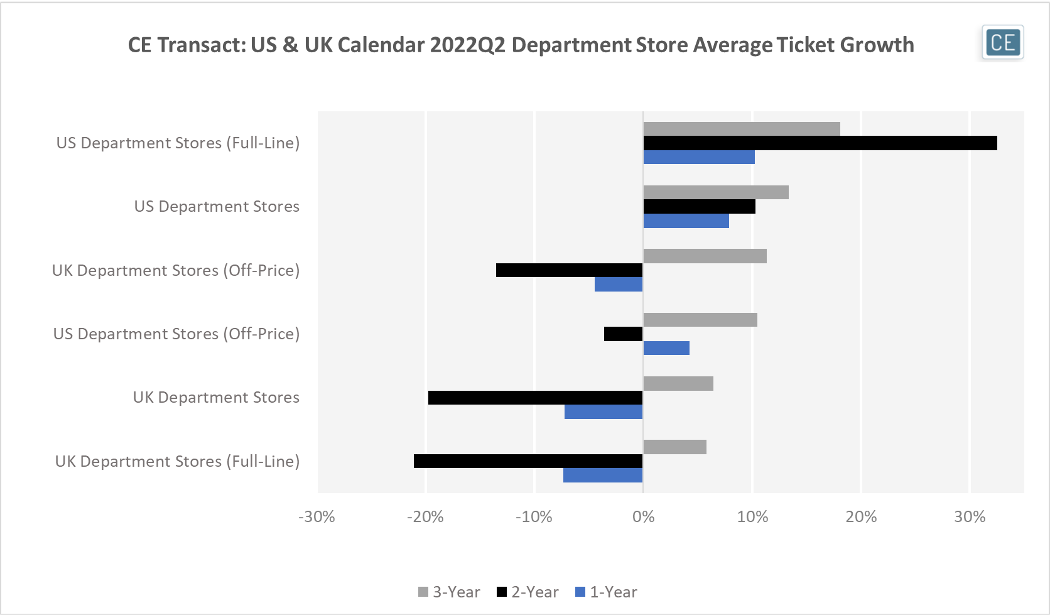
One telling sign is changes in average ticket. Given much of department store spend is discretionary, how much merchandise shoppers are willing to put into one transaction could be a useful indicator of the overall health of the sector. US Department Stores, and especially Full-Line Department Stores, have shown the strongest growth in ticket across a one-year, two-year, and three-year time horizon for Calendar 2022Q2. In the UK, Off-Price stores are showing stronger ticket growth than Full-Line across all three time horizons, while in the US Full-Line stores have shown larger purchases. These trends are despite major Off-Price players Burlington and Ross in the US not having websites to purchase from during COVID store closures.
Average Ticket
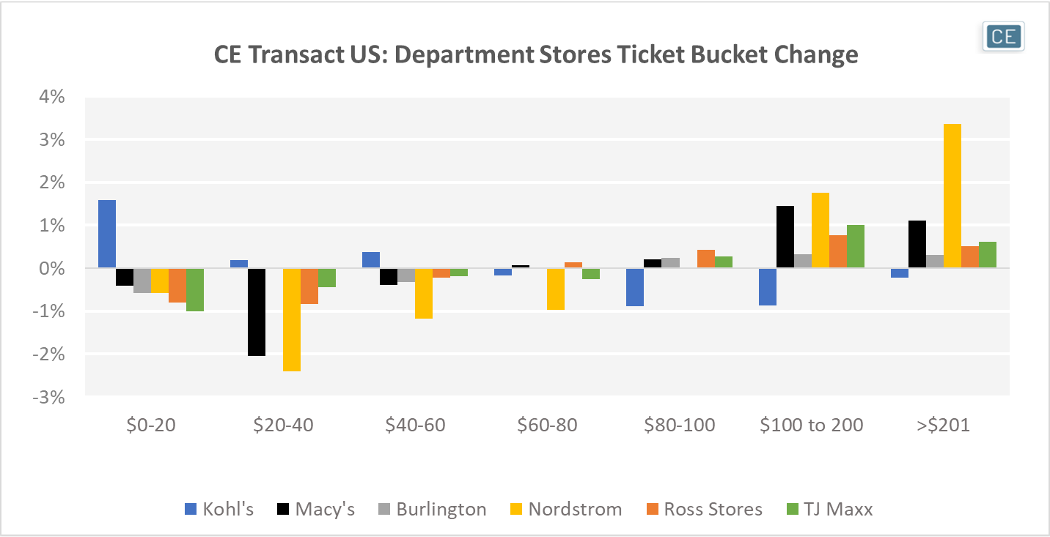
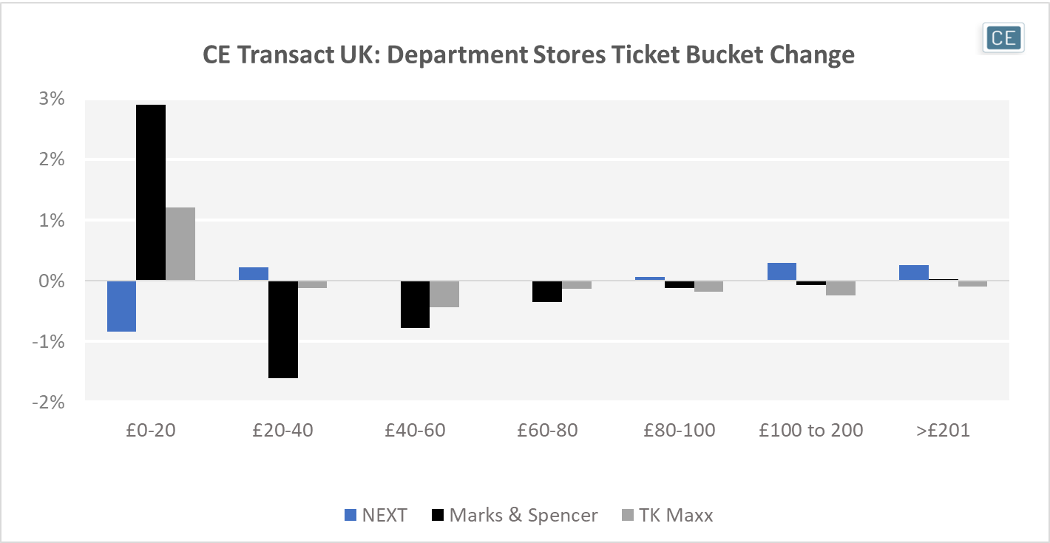
Nordstrom had commented on their earnings call that low-end shoppers were the most impeded by current economic conditions, with clearance items needing additional markdowns but higher-end goods relatively unaffected. Our ticket bucket data supports this narrative, with Nordstrom specifically seeing the highest percentage increase in transactions over $100 and the largest decrease in transactions $20-80 among US Department Stores. On the lower end of the ticket bucket spectrum, only Kohl’s in the US saw an increase in the percentage of transactions $0-60. In the UK, NEXT saw a similar dynamic to Nordstrom with an increase in the percentage of transactions over £100. However, both Marks & Spencer as well as the TJX TK Maxx banner saw an increase in the percentage of transactions below £20
Change in Ticket Bucket
To learn more about the data behind this article and what Consumer Edge Research has to offer, visit www.consumer-edge.com.


Sign up to receive our stories in your inbox.
Data is changing the speed of business. Investors, Corporations, and Governments are buying new, differentiated data to gain visibility make better decisions. Don't fall behind. Let us help.


Sign up to receive our stories in your inbox.
Data is changing the speed of business. Investors, Corporations, and Governments are buying new, differentiated data to gain visibility make better decisions. Don't fall behind. Let us help.


