
Introduction
Welcome to the September 2022 Apartment List National Rent Report. Our national index rose by 0.5 percent over the course of August, half the rate of growth compared to last month. This marks a deceleration of the rental market that follows a typical, pre-pandemic trend. This year rents have risen slightly faster than they did before the pandemic, but significantly slower than they did in 2021 when rent inflation was at its peak. So far in 2022 rents are up 7.2 percent, compared to 14.8 percent at this point in 2021. Year-over-year growth has slowed to 10 percent, down from a pearl of nearly 18 percent at the beginning of the year.
On the supply side, a deceleration in rent growth was matched with a slight uptick in apartment vacancies. Our vacancy index stands at 5.1 percent today and has gradually eased from a low of 4.1 percent last fall. That said, today’s vacancy rate remains below the pre-pandemic norm, which may be attributable to spiking mortgage rates that continue sidelining first-time homebuyers and keeping more households renting for longer.
Rents increased in 79 of the nation’s 100 largest cities in August. But in 68 of those 79 cities, rent growth was slower this month than last month. Annual rent growth remains elevated (15+ percent) in Florida, as well as a handful of major metropolitan areas including San Diego and New York City.
Month-over-month rent growth cools to 0.5%; rents up 10% year-over-year
The national median rent increased by a record-setting 17.6 percent over the course of 2021. This rapid growth in rent prices is a key contributor to overall inflation, which is currently rising at its fastest pace in 40 years.1 With inflation top-of-mind for policymakers and everyday Americans alike, our rent index is particularly relevant, since movements in market rents lead movements in average rents paid. As a result, our index can signal what is likely ahead for the housing component of the official inflation estimates produced by the Bureau of Labor Statistics. Thankfully for the country’s renters, our index shows that rent growth in 2022 has cooled from last summer’s peaks. At the same time, however, rents are continuing to rise faster than they did in pre-pandemic years.
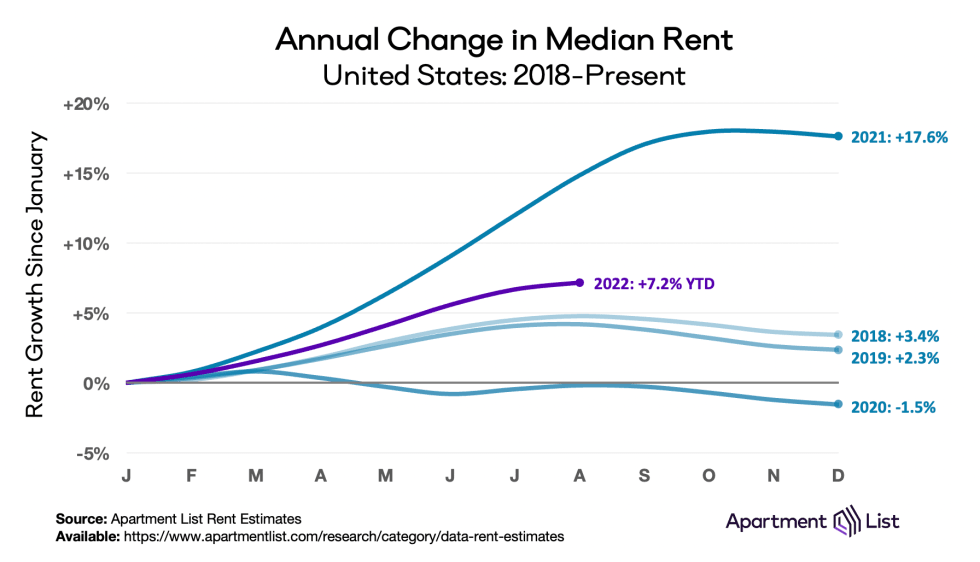
In the first eight months of this year our national rent index has increased by 7.2 percent, which is less than half the 14.8 percent increase that took place during the same months last year. That said, this year’s pace remains notably faster than the years prior to 2021. For comparison, rent growth from January to August totalled 4.8 percent in 2018, 4.2 percent in 2019, and -0.2 percent in 2020.
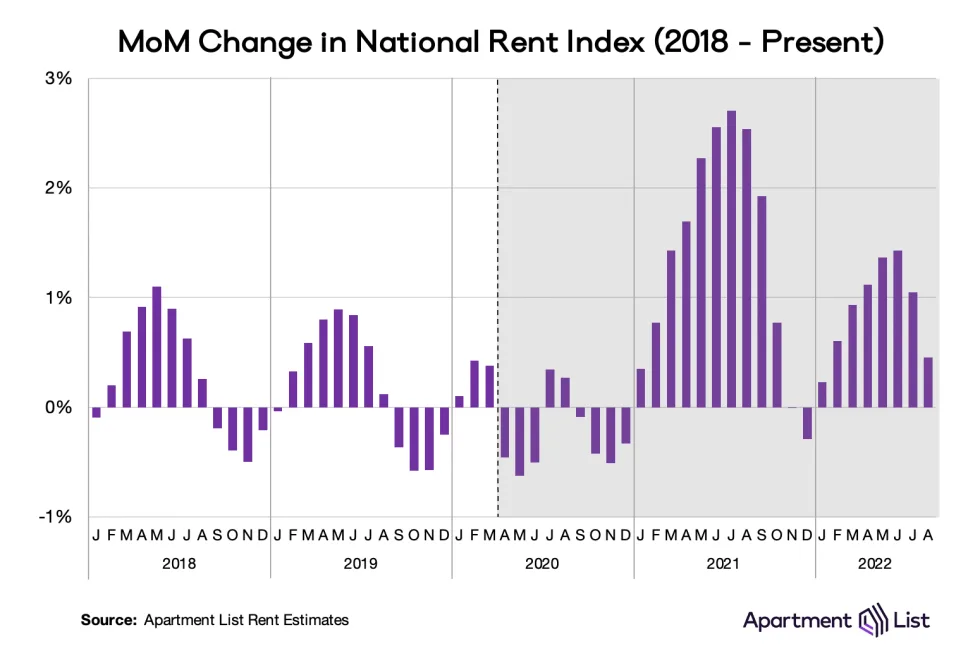
Our national rent index increased by 0.5 percent month-over-month in August, one-half the increase we saw last month (1.0 percent in July 2022) and one-fifth the increase we saw last year (2.5 percent in August 2021). Not only is rent growth decelerating, it is decelerating when we historically expect it to. Before the pandemic, rent growth would peak in late-summer before softening for several months throughout the fall and winter. 2021 was a major exception, when growth accelerated for an additional two months and did not subside until November. In 2022, rent growth is a bit higher than it was in 2019 and 2018, but the trajectory looks similar to those pre-pandemic years. If the trend holds, we can expect near-flat, or potentially negative, rent growth in September.
As rent growth slows, vacancies ease
As we’ve explored in detail, much of the 2021 rent boom was attributable to a tight market in which more households were competing for fewer vacant units. Our vacancy index spiked above 7 percent in the early months of the pandemic in 2020, as many Americans consolidated households and moved in with family amid the uncertainty and economic disruption of the pandemic’s onset. After that, however, rapid household formation chipped away at the vacancy rate, eventually falling to a low of 4.1 percent.
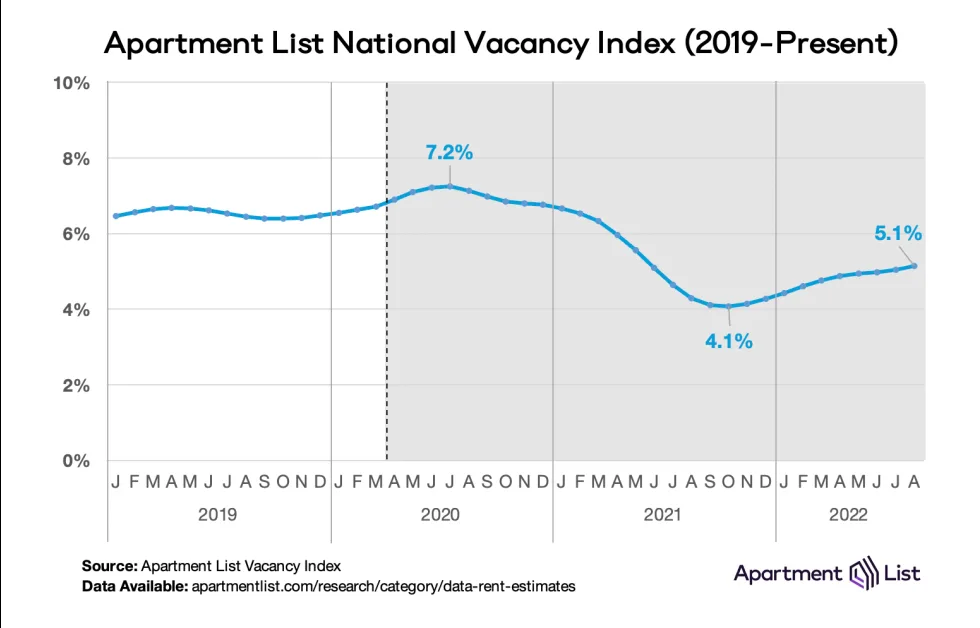
After bottoming out at 4.1 percent in October 2021, our national vacancy index has been on a trend of gradual easing. This month it rose to 5.1 percent and has shown nearly one full year of continued, albeit slow, improvements. Rental vacancies are heavily dependent on housing availability in the for-sale market, and it’s possible that spiking mortgage rates have kept the rental vacancy rate from rebounding quickly post-pandemic. High interest rates can sideline potential first-time homebuyers and keep them in the rental market longer. Two years of sustained rent inflation may also be incentivizing renters to stay put and renew existing leases rather than looking for new ones.
Vacancy trends are highly localized, and they played a major role in determining how quickly rent inflation affected cities throughout the pandemic. To explore the topic in greater detail, monthly vacancy data are now available for download for hundreds of cities, metros, and states, and can be easily linked to our existing rent estimates using Federal Information Processing System (FIPS) codes.
Rents up month-over-month in 79 of 100 largest cities
The chart below visualizes monthly rent changes in each of the nation’s 100 largest cities from January 2019 to present. The color in each cell represents the extent to which prices went up (red) or down (blue) in a given city in a given month. In 2020, we can see that rents fell sharply in many of the nation’s largest and most expensive cities, while smaller and more affordable ones picked up steam, leading to some convergence in prices. Meanwhile, the dark red band in 2021 depicts last year’s rent heatwave, which peaked in July and August 2021 when all 100 cities in this chart saw prices go up. The rightmost columns show that virtually across the board, rent growth remains positive but has cooled significantly from last year’s pace.
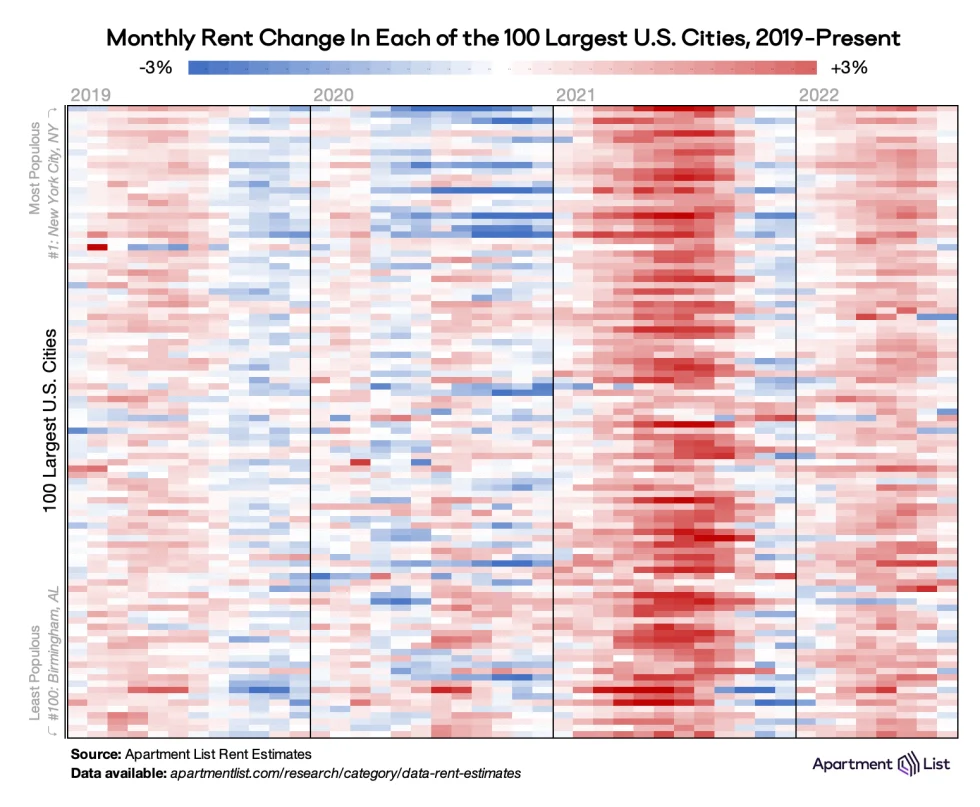
Rents increased this month in 79 of the nation’s 100 largest cities, but 68 of these cities experienced slower rent growth in August than they did in July. And rents are growing slower than last year in nearly every one of those 79 cities.
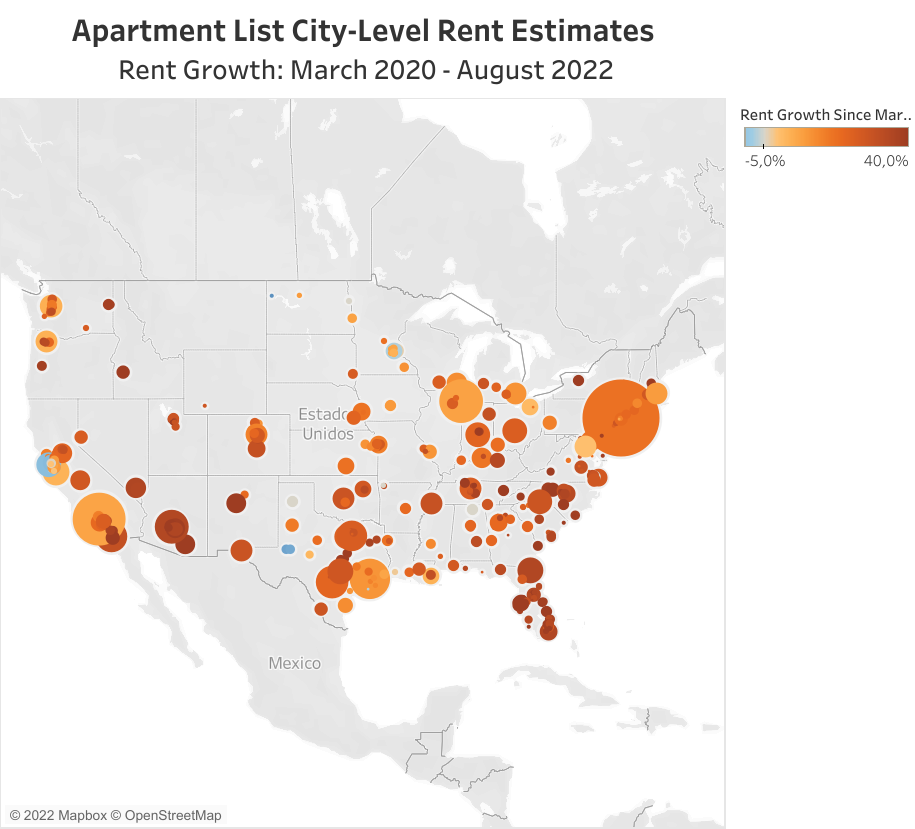
The urban core of the New York City region has been experiencing surging rental demand this year. Among large cities, Jersey City currently has the nation’s fastest city-level rent growth, with prices up by 24.5 percent over the past twelve months, more than doubling the national average. Meanwhile, NYC-proper also ranks in the top ten with a year-over-year rent increase of 16.6 percent. Elsewhere, rent growth is widespread and distributed across the country. Large cities with rapid annual rent growth include Chula Vista, CA (+20.3 percent), Anchorage, AK (+19.3 percent), and Miami, FL (+18.7 percent).
Pricey coastal metros seeing prices rise again
Major markets throughout the Sun Belt have experienced virtually-uninterrupted rent growth since the start of the pandemic, but over the past six months, the fastest growth has been occurring in two types of cities: pricey coastal markets as well as Great Lakes metros. The following table shows the ten metropolitan areas that have experienced the fastest rent growth over the past six months, over the past year, and since the pandemic started in March 2020:
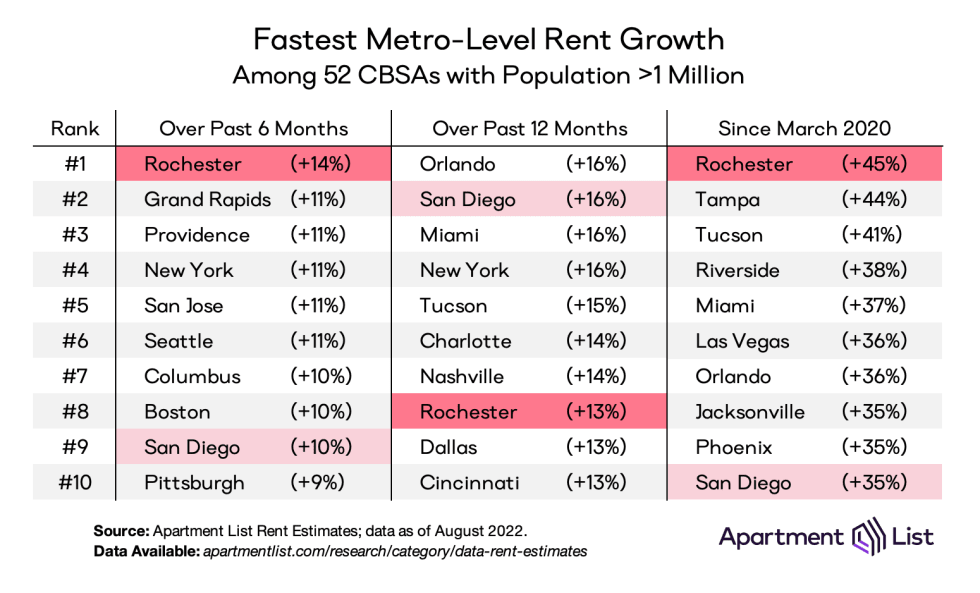
The six-month column shows that some of the nation’s expensive coastal markets – which had seen sharp declines at the start of the pandemic – are now heating up again. The San Jose, Seattle, Boston, and New York metros all rank among the top ten here, and are continuing strong rebounds. Meanwhile, San Diego and Providence are the only markets that appear in all three columns of the table. The remaining four markets, Rochester NY, Grand Rapids MI, Columbus OH, and Pittsburgh PA, are all concentrated in the Midwest and Northeast, but away from the expensive coastal regions. As hybrid remote work continues to take hold, these more-affordable mid-sized markets may emerge as attractive alternatives for those who only need to commute occasionally.
The rightmost column shows that most of the markets that have experienced the fastest growth over the course of the pandemic are primarily located in the Sun Belt, with California, Arizona, Nevada, and Florida accounting for nine of the top ten. That said, Rochester NY metro ranks number one for pandemic-era rent growth, with rents there up by a staggering 45 percent since March 2020. Rochester has recently taken the top spot from Tampa, where growth has cooled down in recent months. Once the country’s epicenter for rent inflation, prices in Tampa are up 7.1 percent since January, slightly below the national average.
Rents in the San Francisco metro are finally back to pre-pandemic rent levels
The San Francisco metro experienced the sharpest rent declines in the first year of the pandemic, and has been the slowest market to recover in the time since then. This month however, the median rent in the area has finally risen back above its March 2020 level. The metro-wide median rent today, $2,188, is now 0.1 percent higher than it was before the pandemic. Note that at the city-level, some markets in the San Francisco Bay Area have yet to fully recover. In San Francisco proper prices are still down 9 percent, in Oakland they are down 10 percent, and in Palo Alto they are down 4 percent.
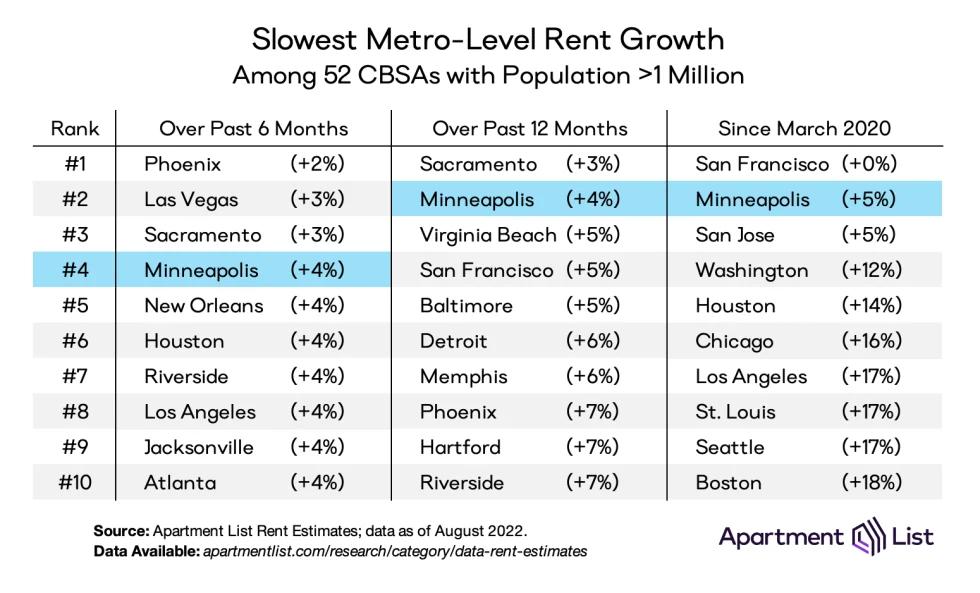
After San Francisco the right-most column of the table is largely populated by other pricey coastal metros, including San Jose; Washington, D.C.; Los Angeles; Seattle; and Boston. Even as many of these markets have been heating up recently, they have still had among the most modest rent growth over the course of the pandemic as a whole. That said, just three metros have experienced rent growth of less than 10 percent over the past two and a half years.
Notably, the table above also shows how some of the markets that had been booming fastest are now showing signs of cooling off. For example, the Phoenix metro has experienced the slowest rent growth over the past six months, with an increase of just 2 percent, despite ranking in the top ten for fastest growth since March 2020. Similarly, the Las Vegas, Jacksonville, and Riverside metros rank among the top ten for fastest pandemic-era rent growth, but have seen among the slowest growth in the first half of this year. After booming consistently for two years, these markets are finally beginning to plateau. Minneapolis is the only metro to appear in all three columns of the table above, with consistently sluggish growth throughout the pandemic. Minneapolis city, and its nearby suburb Richfield, are two of only nine cities across the country where prices remain below pre-pandemic levels.
Conclusion
With a 0.5 percent increase in August, rent growth is continuing to pace ahead of pre-pandemic trends, even as it decelerates and falls in-line with expected seasonality. As we enter the fall and winter months, we expect rental activity will continue to slow and we will likely see modest price decreases in the coming months. But while the apartment market is showing early signs of easing, a national vacancy index of 5.1 percent remains below the pre-pandemic norm and indicates there is steady pressure on the rental market, keeping it unlikely that prices will fall substantially.
To learn more about the data behind this article and what Apartment List has to offer, visit https://www.apartmentlist.com/.


Sign up to receive our stories in your inbox.
Data is changing the speed of business. Investors, Corporations, and Governments are buying new, differentiated data to gain visibility make better decisions. Don't fall behind. Let us help.


Sign up to receive our stories in your inbox.
Data is changing the speed of business. Investors, Corporations, and Governments are buying new, differentiated data to gain visibility make better decisions. Don't fall behind. Let us help.