
Introduction
The CoreLogic Home Price Insights report features an interactive view of our Home Price Index product with analysis through July 2022 with forecasts through July 2023.
CoreLogic HPI™ is designed to provide an early indication of home price trends. The indexes are fully revised with each release and employ techniques to signal turning points sooner. CoreLogic HPI Forecasts™ (with a 30-year forecast horizon), project CoreLogic HPI levels for two tiers—Single-Family Combined (both Attached and Detached) and Single-Family Combined excluding distressed sales.
The report is published monthly with coverage at the national, state and Core Based Statistical Area (CBSA)/Metro level and includes home price indices (including distressed sales); home price forecast and market condition indicators. The data incorporates more than 40 years of repeat-sales transactions for analyzing home price trends.
HPI National Change
July 2022 National Home Prices
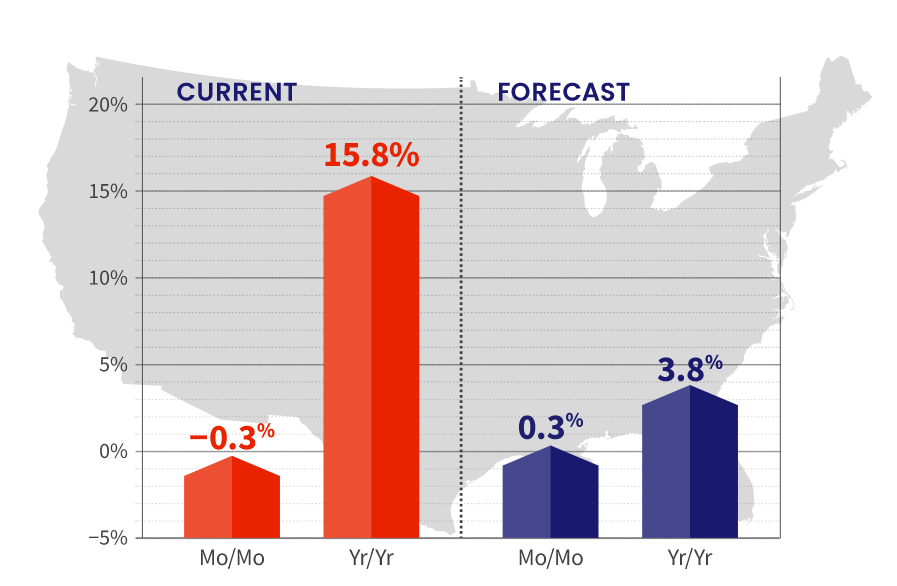
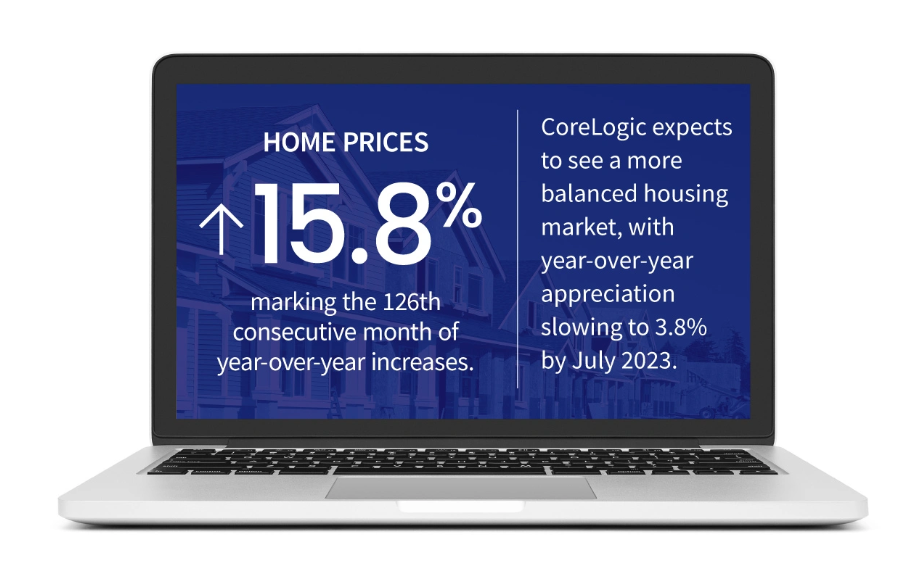
Home prices nationwide, including distressed sales, increased year over year by 15.8% in July 2022 compared with July 2021. On a month-over-month basis, home prices declined by 0.3% in July 2022 compared with June 2022 (revisions with public records data are standard, and to ensure accuracy, CoreLogic incorporates the newly released public data to provide updated results).
Forecast Prices Nationally
The CoreLogic HPI Forecast indicates that home prices will increase on a month-over-month basis by 0.3% from July 2022 to August 2022 and on a year-over-year basis by 3.8% from July 2022 to July 2023.
HPI & Case-Shiller Trends
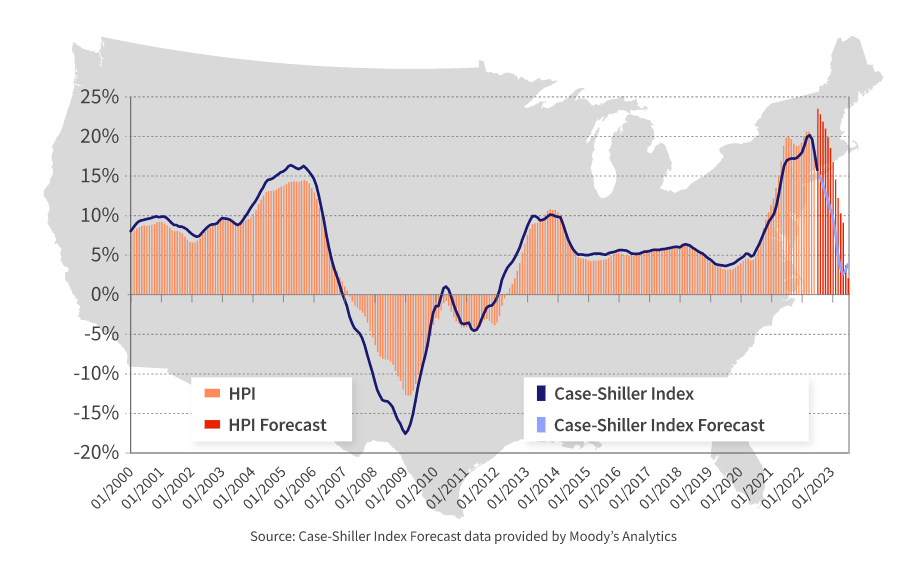
This graph shows a comparison of the national year-over-year percent change for the CoreLogic HPI and CoreLogic Case-Shiller Index from 2000 to present month with forecasts one year into the future. We note that both the CoreLogic HPI Single Family Combined tier and the CoreLogic Case-Shiller Index are posting positive, but moderating year-over-year percent changes, and forecasting gains for the next year.
Housing Market Showing Signs of Better Balance
Annual home price growth slowed for the third consecutive month in July but remained elevated at 15.8%. As 30-year, fixed-rate mortgages neared 6% this summer, some prospective homebuyers pulled back, helping ease overheated and unsustainable price growth. Notably, home prices declined by 0.3% from June to July, a trend not seen between 2010 and 2019, when price increases averaged 0.5% between those two months, according to CoreLogic’s historic data. Looking ahead, CoreLogic expects to see a more balanced housing market, with year-over-year appreciation slowing to 3.8% by July 2023.
“Following June’s surge in mortgage rates and the resulting dampening effect on housing demand, price growth is taking a decisive turn. And even though annual price growth remains in double digits, the month-over-month decline suggests further deceleration on the horizon. The higher cost of homeownership has clearly eroded affordability, as inflation-adjusted monthly mortgage expenses are now even higher than they were at their former peak in 2006.”
– Selma Hepp
Interim Lead, Deputy Chief Economist for CoreLogic
HPI National and State Maps – July 2022
The CoreLogic HPI provides measures for multiple market segments, referred to as tiers, based on property type, price, time between sales, loan type (conforming vs. non-conforming) and distressed sales. Broad national coverage is available from the national level down to ZIP Code, including non-disclosure states.
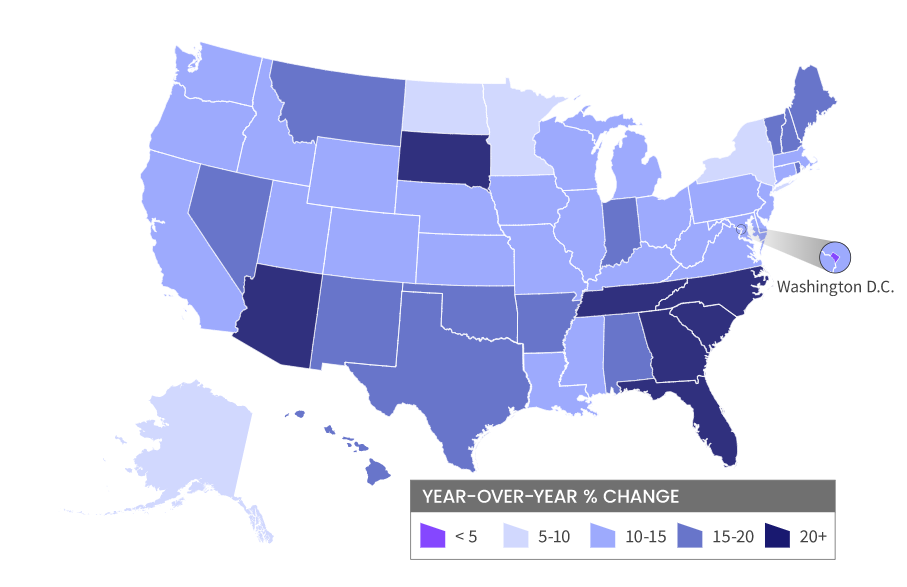
Nationally, home prices increased 15.8% year over year in July. No states posted an annual decline in home prices. The states with the highest increases year over year were Florida (29.6%), South Dakota (23.7%) and Tennessee (23.2%).
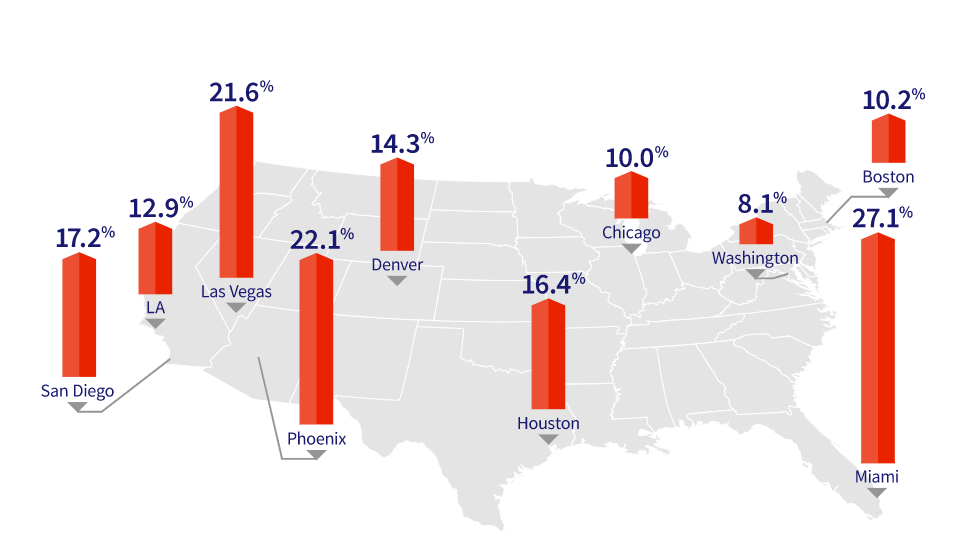
HPI Top 10 Metros Change
The CoreLogic HPI provides measures for multiple market segments, referred to as tiers, based on property type, price, time between sales, loan type (conforming vs. non-conforming) and distressed sales. Broad national coverage is available from the national level down to ZIP Code, including non-disclosure states.
These large cities continued to experience price increases in July, with Miami on top at 27.1% year over year.
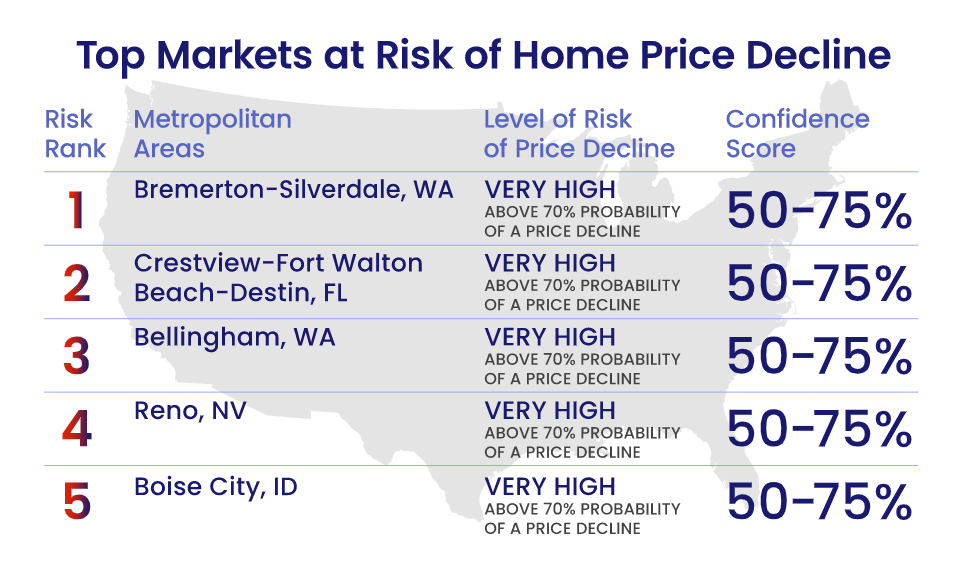
Markets to Watch: Top Markets at Risk of Home Price Decline
The CoreLogic Market Risk Indicator (MRI), a monthly update of the overall health of housing markets across the country, predicts that Bremerton-Silverdale, WA is at a very high risk (70%-plus probability) of a decline in home prices over the next 12 months. Crestview-Fort Walton Beach-Destin, FL; Bellingham, WA; Reno, NV and Boise City, ID are also at very high risk for price declines.
To learn more about the data behind this article and what CoreLogic has to offer, visit https://www.corelogic.com/.


Sign up to receive our stories in your inbox.
Data is changing the speed of business. Investors, Corporations, and Governments are buying new, differentiated data to gain visibility make better decisions. Don't fall behind. Let us help.


Sign up to receive our stories in your inbox.
Data is changing the speed of business. Investors, Corporations, and Governments are buying new, differentiated data to gain visibility make better decisions. Don't fall behind. Let us help.