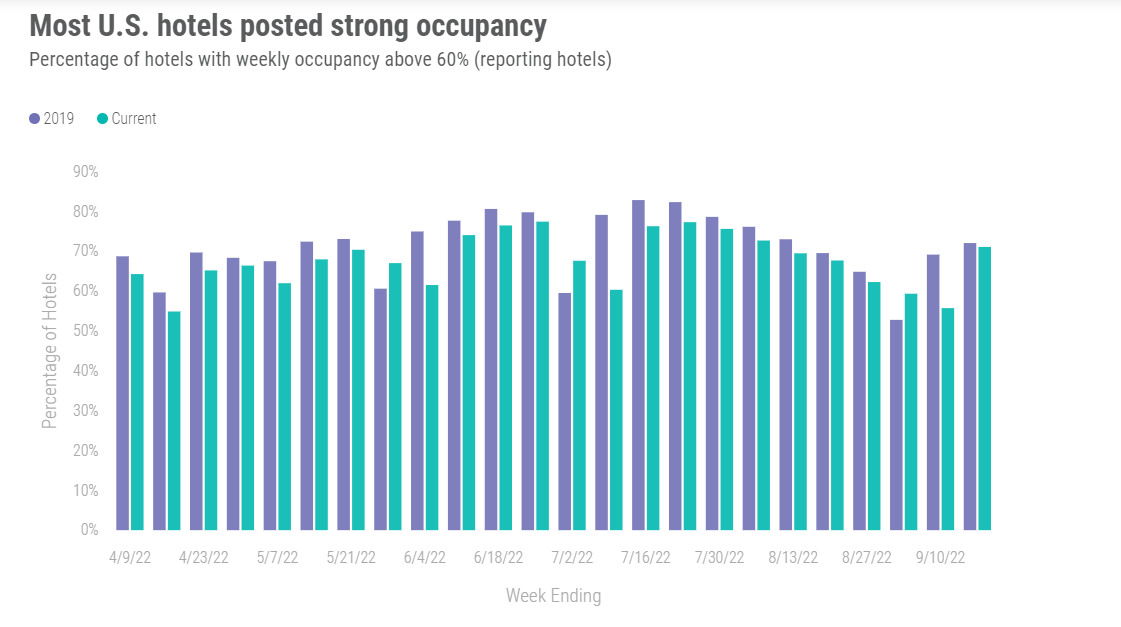
As anticipated, U.S. hotel demand for the week of 11-17 September 2022 soared back, increasing 13% week on week (WoW) and pushing occupancy to a six-week high of 69.6%. Weekday (Monday-Wednesday) occupancy was slightly better at 69.9%, with the measure reaching 75.5% in the Top 25 Markets—the second highest level of the pandemic-era behind the week ending 18 June 2022. Nominal average daily rate (ADR) made its way to a seven-week high (US$156), up 5.8% WoW and +18% year on year. Real ADR was equal to 2019. After three weeks below US$100, nominal revenue per available room (RevPAR) jumped to US108, which was 19.4% greater than a week ago and 31% higher than the same week last year. Real RevPAR was just under 2019’s value.
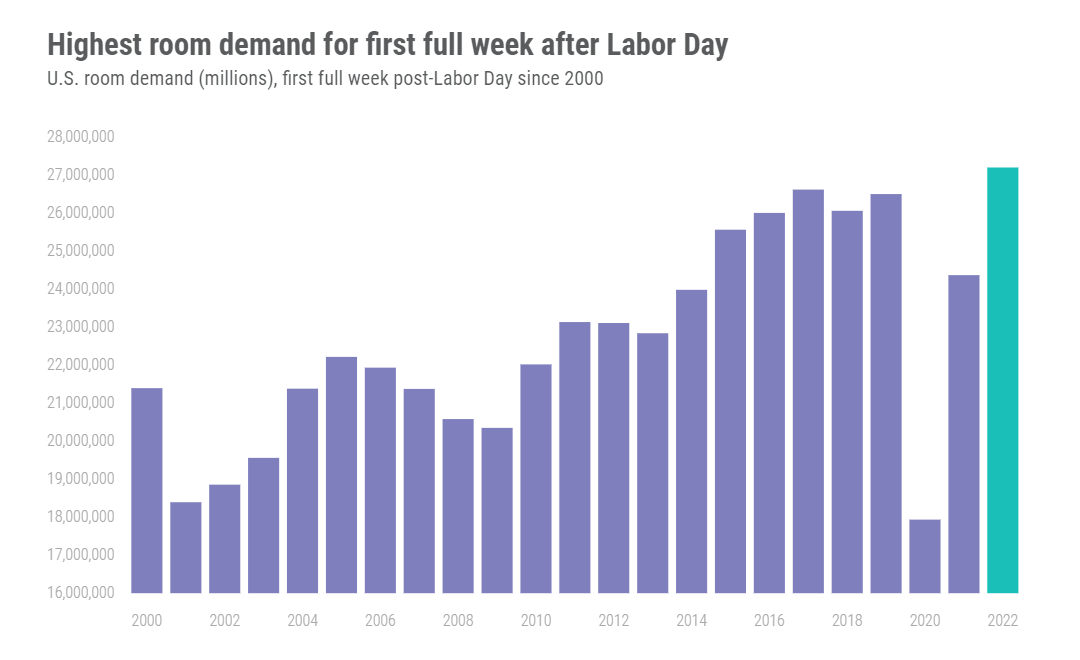
Over the past 22 years, the demand increase for the first full week after the Labor Day holiday has averaged 14.5%, so this recent gain was a bit shy of that growth rate and at the lower end of the range (+11.8%-18%). However, demand was the highest for the full week after the Labor Day holiday (27.2 million). At the same time, that demand level was not the highest for week 38—that occurred in 2019. The difference between the two was just 8,000 room nights even though week 38 in 2019 was two weeks after the Labor Day holiday.
We can surmise that business and group travel contributed the most to the strong growth in weekday demand, which was the at the seventh highest level since the start of the pandemic. The previous six pandemic-era highs in weekday demand were all achieved during the 2022 summer season, when leisure travelers were also filling hotel rooms. Excluding the prime summer travel months (June & July), weekday demand was the highest since the start of the pandemic and the 15th highest of all time going back to 2000.
The Top 25 Markets benefited the most by the return of business and group travelers. Weekday occupancy topped 70% in 18 of the markets with six (Boston, Chicago, Denver, New York City, San Francisco, and Seattle) surpassing 80%. Seattle (92%) and NYC (91%) were at the top of that leaderboard. Further, Chicago, New York, and Seattle saw their highest weekday demand since the start of the pandemic. And while Philadelphia’s weekday occupancy was 69%, it too saw its highest weekday demand in the cycle. Four markets were laggards this week (Houston, Miami, New Orleans, and Tampa) with weekday occupancy in the low 60s. September is normally the lowest occupancy month for Miami and Tampa, so that is not a surprise, but Houston and New Orleans tend to go up at this time of year.
Central Business Districts (CBDs) also saw their highest weekday demand and occupancy of the pandemic-era as occupancy reached 79%. Four CBDs (Boston, Chicago, the New York Financial District, and Seattle) saw weekday occupancy surpass 90% with all others above 65% and most above 70% except New Orleans (47%). Full week demand and occupancy (76%) was also the highest of the pandemic-era.
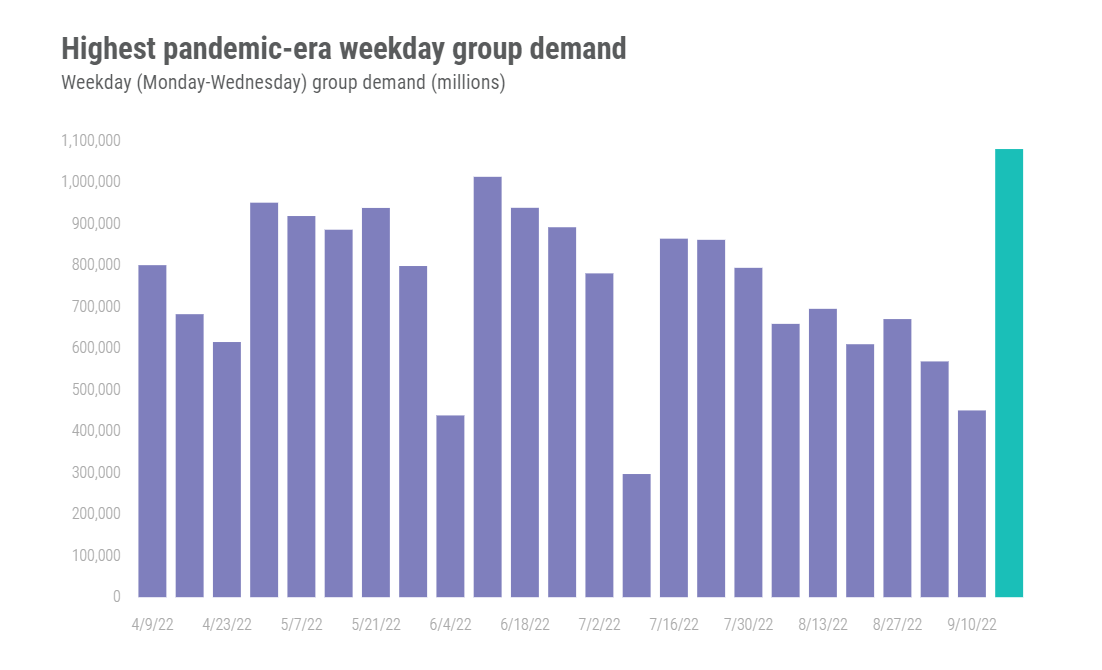
Weekday group demand also reached a pandemic-era record as room nights topped 1.1 million among Luxury and Upper Upscale class hotels. Weekday group demand was also among the largest of the past 20 years, ranking 19th. We estimate that total group demand, all chain scales and classes, accounted for more than a third of the gain in weekday demand and made up 16% of the industry’s total weekday demand.
Weekday occupancy in the predominately business-oriented chain scales (Upper Upscale, Upscale, and Upper Midscale) were all in the mid-70% range, led by Upper Upscale (79%). Not surprising, Upper Upscale saw its highest demand level since the start of the pandemic. More than half of the weekday demand gain by Upper Upscale chains came from increased group, which made up 36% of weekday demand. Four of the seven chain scales also saw full week occupancy above 70% with Luxury posting its highest weekly occupancy of the pandemic-era (73%).
Weekend occupancy also returned from its post-summer doldrums at 77%. Weekend occupancy was slightly higher in the Top 25 Markets (78%) with half of the markets above 80% and all but two above 70%. The highest weekend occupancy among all submarkets was seen in Gatlinburg (95%) and Pigeon Forge (95%), each in Tennessee.
Weekly nominal ADR showed a large jump but so did real ADR, increasing to US$135, which was slightly better than what was seen in the comparable week of 2019. Weekly Top 25 Market nominal ADR reached a pandemic-era high (US$189) as did real ADR (US$164), which surpassed the previous high seen at the beginning of the year and reached its highest level since the first week of December 2019. Weekday nominal ADR in the Top 25 was even higher (US$195) and was the third highest in history. Real weekday ADR topped (US$169).
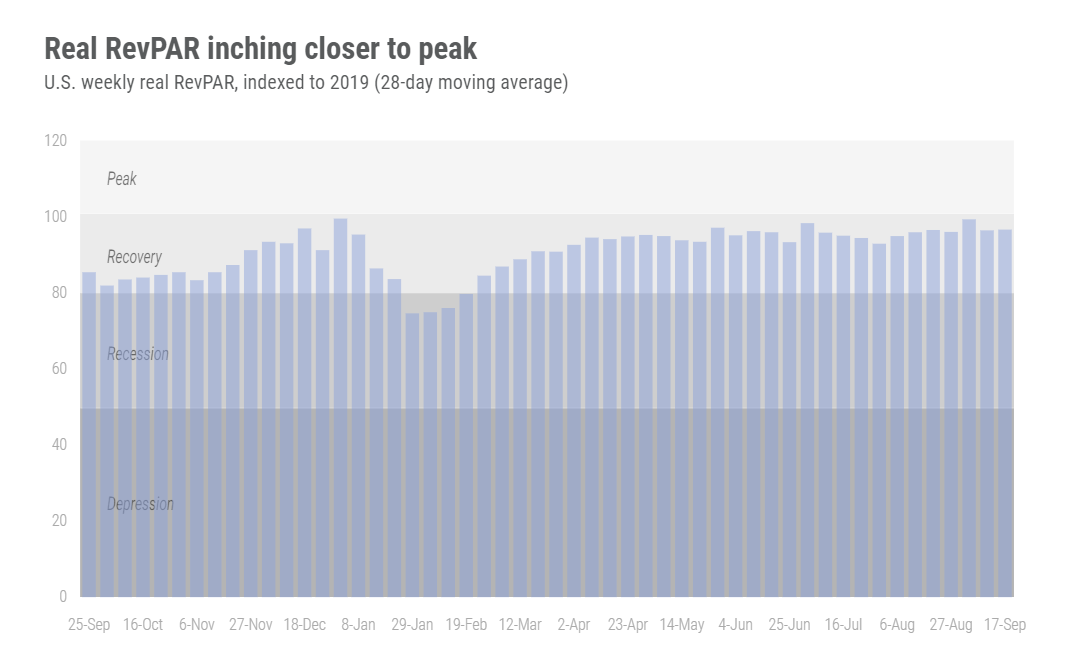
With the jump in demand and the continued surge in ADR, nominal RevPAR was above 2019 levels in nearly every market during the week. Half of all markets had weekly Real RevPAR above 2019 including Chicago, Miami, Orlando, San Diego, and Phoenix. Among the Top 25 Markets, Orlando had the highest weekday real RevPAR level above 2019, which was 19% greater than in that year.
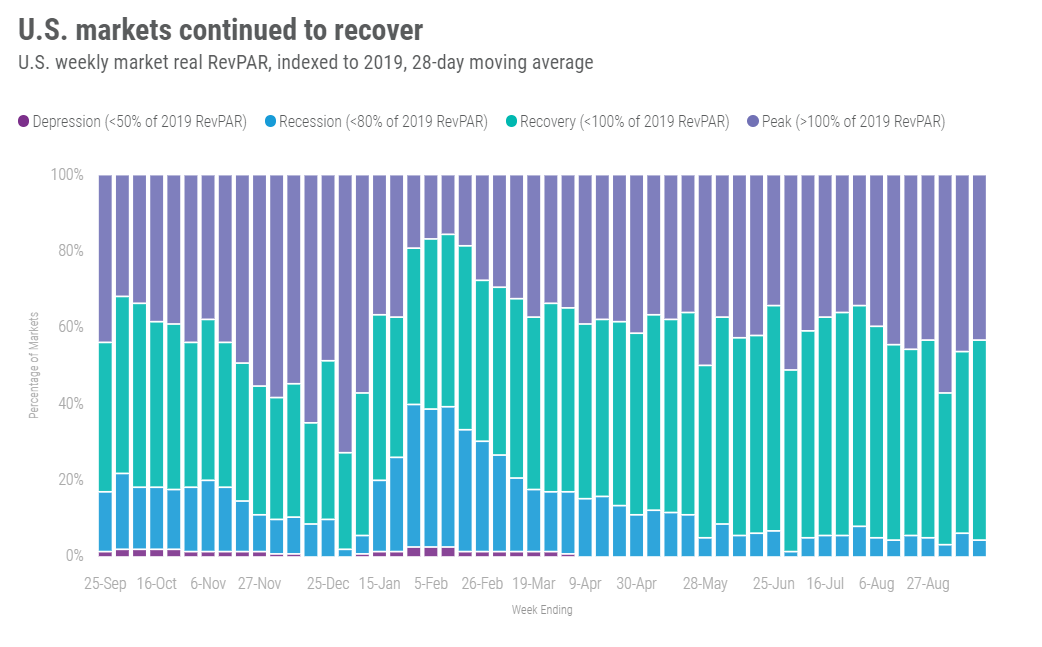
In the 28 days ending 17 September, 43% of the 166 STR-defined U.S. markets had real RevPAR above 2019. Only two markets, San Jose and San Francisco were still categorized as being in “recession” as real RevPAR was less than 80% of what it was in 2019.
Around the Globe
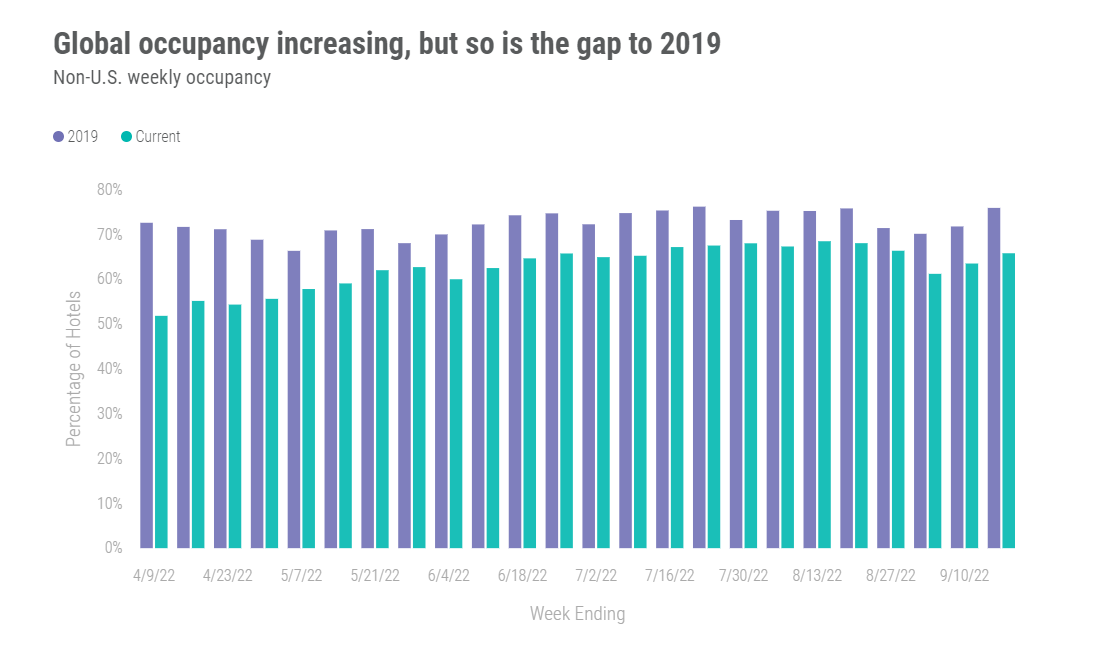
Occupancy outside the U.S. reflected a second consecutive week of growth, up 2.3 percentage points to 65.8%. Despite that growth, occupancy was more than 10 percentage points lower than in 2019. Both nominal ADR and RevPAR also increased (+1.2% and +4.9%, respectively) for a second consecutive week as well. Both measures remained above their 2019 levels as they have done for the past 12 weeks. Not surprising, real RevPAR, averaging 5% above 2019 over the past four weeks, is being driven by strong ADR growth, which has averaged more than 17% higher than what it was in 2019.
Ireland (92%) had this week’s highest country-level occupancy, led by Dublin (96%), where occupancy increased by more than six percentage points week on week and was the highest market occupancy in the world. Multiple tour dates from Garth Brooks have played a key role in lifting Dublin’s levels. Greece also saw strong occupancy (86%) as did Luxembourg (85%) and Portugal (84%).
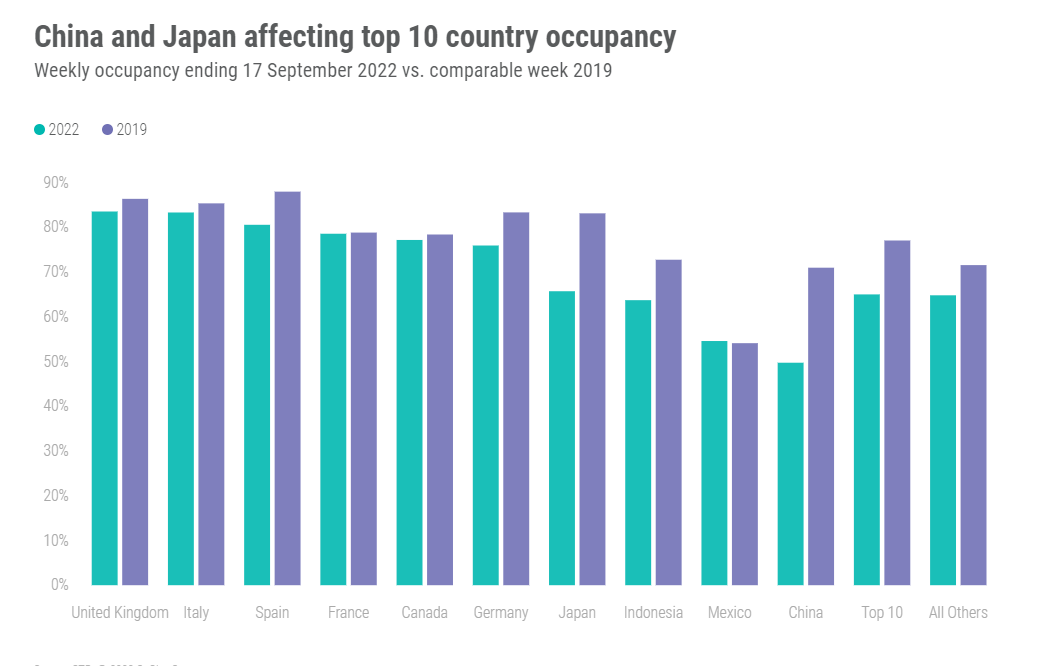
Among the top 10 countries based on supply, the U.K. had the highest weekly occupancy (84%) followed by Italy (83%) and Spain (81%). Overall, occupancy among the top 10 countries stood at 65%, which was more than 12 percentage points below the comparable week in 2019. Japan and China continued to be a significant drag on the aggregate occupancy of the top 10 countries. Japan was 17 percentage points below 2019 while China was 21 percentage points lower. However, after five weeks of declines, China saw occupancy rise 1.6 percentage points WoW.
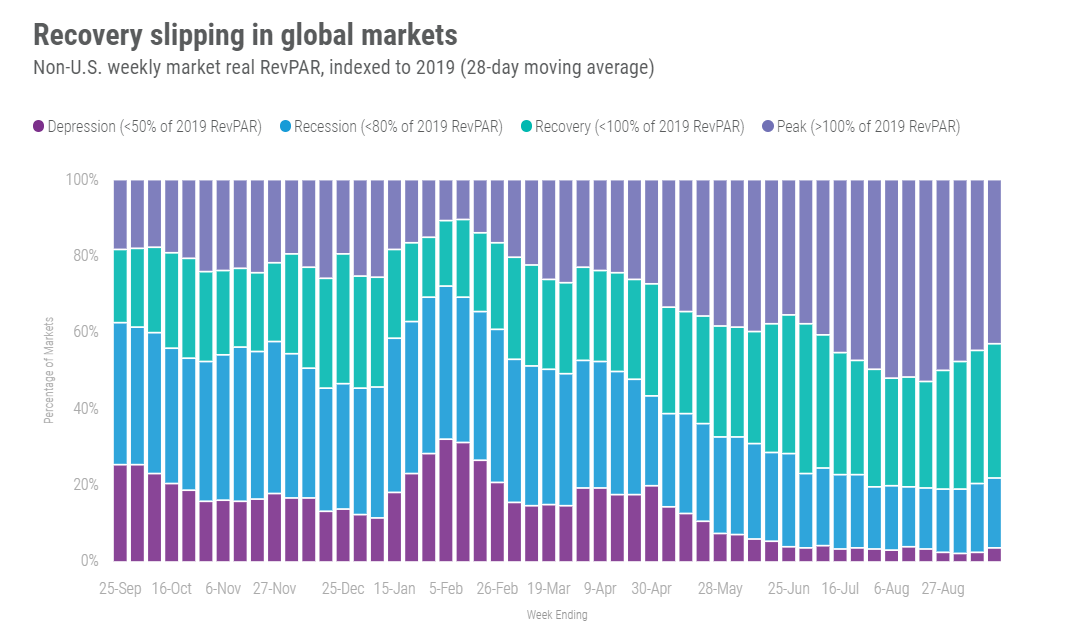
The percentage of markets at “peak” (above 2019) real RevPAR on a 28-days moving average decelerated to 43% versus 45% as week earlier. Additionally, a higher percentage of markets were in “depression” (real RevPAR less than 50% of 2019) with the other categories remaining somewhat stable.
Big Picture
While a week does not make a trend, and the road to recovery for business and group travel will likely have many ups and downs, the week after Labor Day showed that recovery in the segment has gained momentum—particularly in the Top 25 Markets, where the absence has been apparent. However, the next several weeks will likely cause some anxiousness as it relates to those segments, but it’s all predictable. The week ending 24 September will likely be flat to up week on week. Thereafter, the following two weeks (ending 1 October and 8 October) will see week-on-week decreases due to the observances of Rosh Hashanah, 25 – 27 September, and Yom Kippur, 4 – 5 October, which will impact business and group travel. Weekday business and group travel should then resume and continue for the month. In addition, leisure travel will be aided by various school breaks around Columbus/Indigenous Day.
To learn more about the data behind this article and what STR has to offer, visit https://str.com/.


Sign up to receive our stories in your inbox.
Data is changing the speed of business. Investors, Corporations, and Governments are buying new, differentiated data to gain visibility make better decisions. Don't fall behind. Let us help.


Sign up to receive our stories in your inbox.
Data is changing the speed of business. Investors, Corporations, and Governments are buying new, differentiated data to gain visibility make better decisions. Don't fall behind. Let us help.


