
With warnings that inflation could exceed 20% by the start of next year, plans to introduce a tighter rent cap for tenants in the social rented sector are being discussed, to try help insulate some of the most vulnerable from the current cost of living crisis. However, this rent cap could negatively impact housing associations and affect their ability to maintain and improve existing residents’ homes and deliver more new affordable housing.
Figure 1 shows the Credit Consensus Indicators1 (CCIs) for UK Housing Associations.
Detailed consensus credit data is available on Bloomberg or via the CB Web App, covering many otherwise unrated companies. To arrange a demo of all single name and aggregate data detailed in this report, please request this by sending us an email.
Figure 1: Credit Consensus Indicators (CCIs), UK Housing Associations: Jan-20 to Aug-22
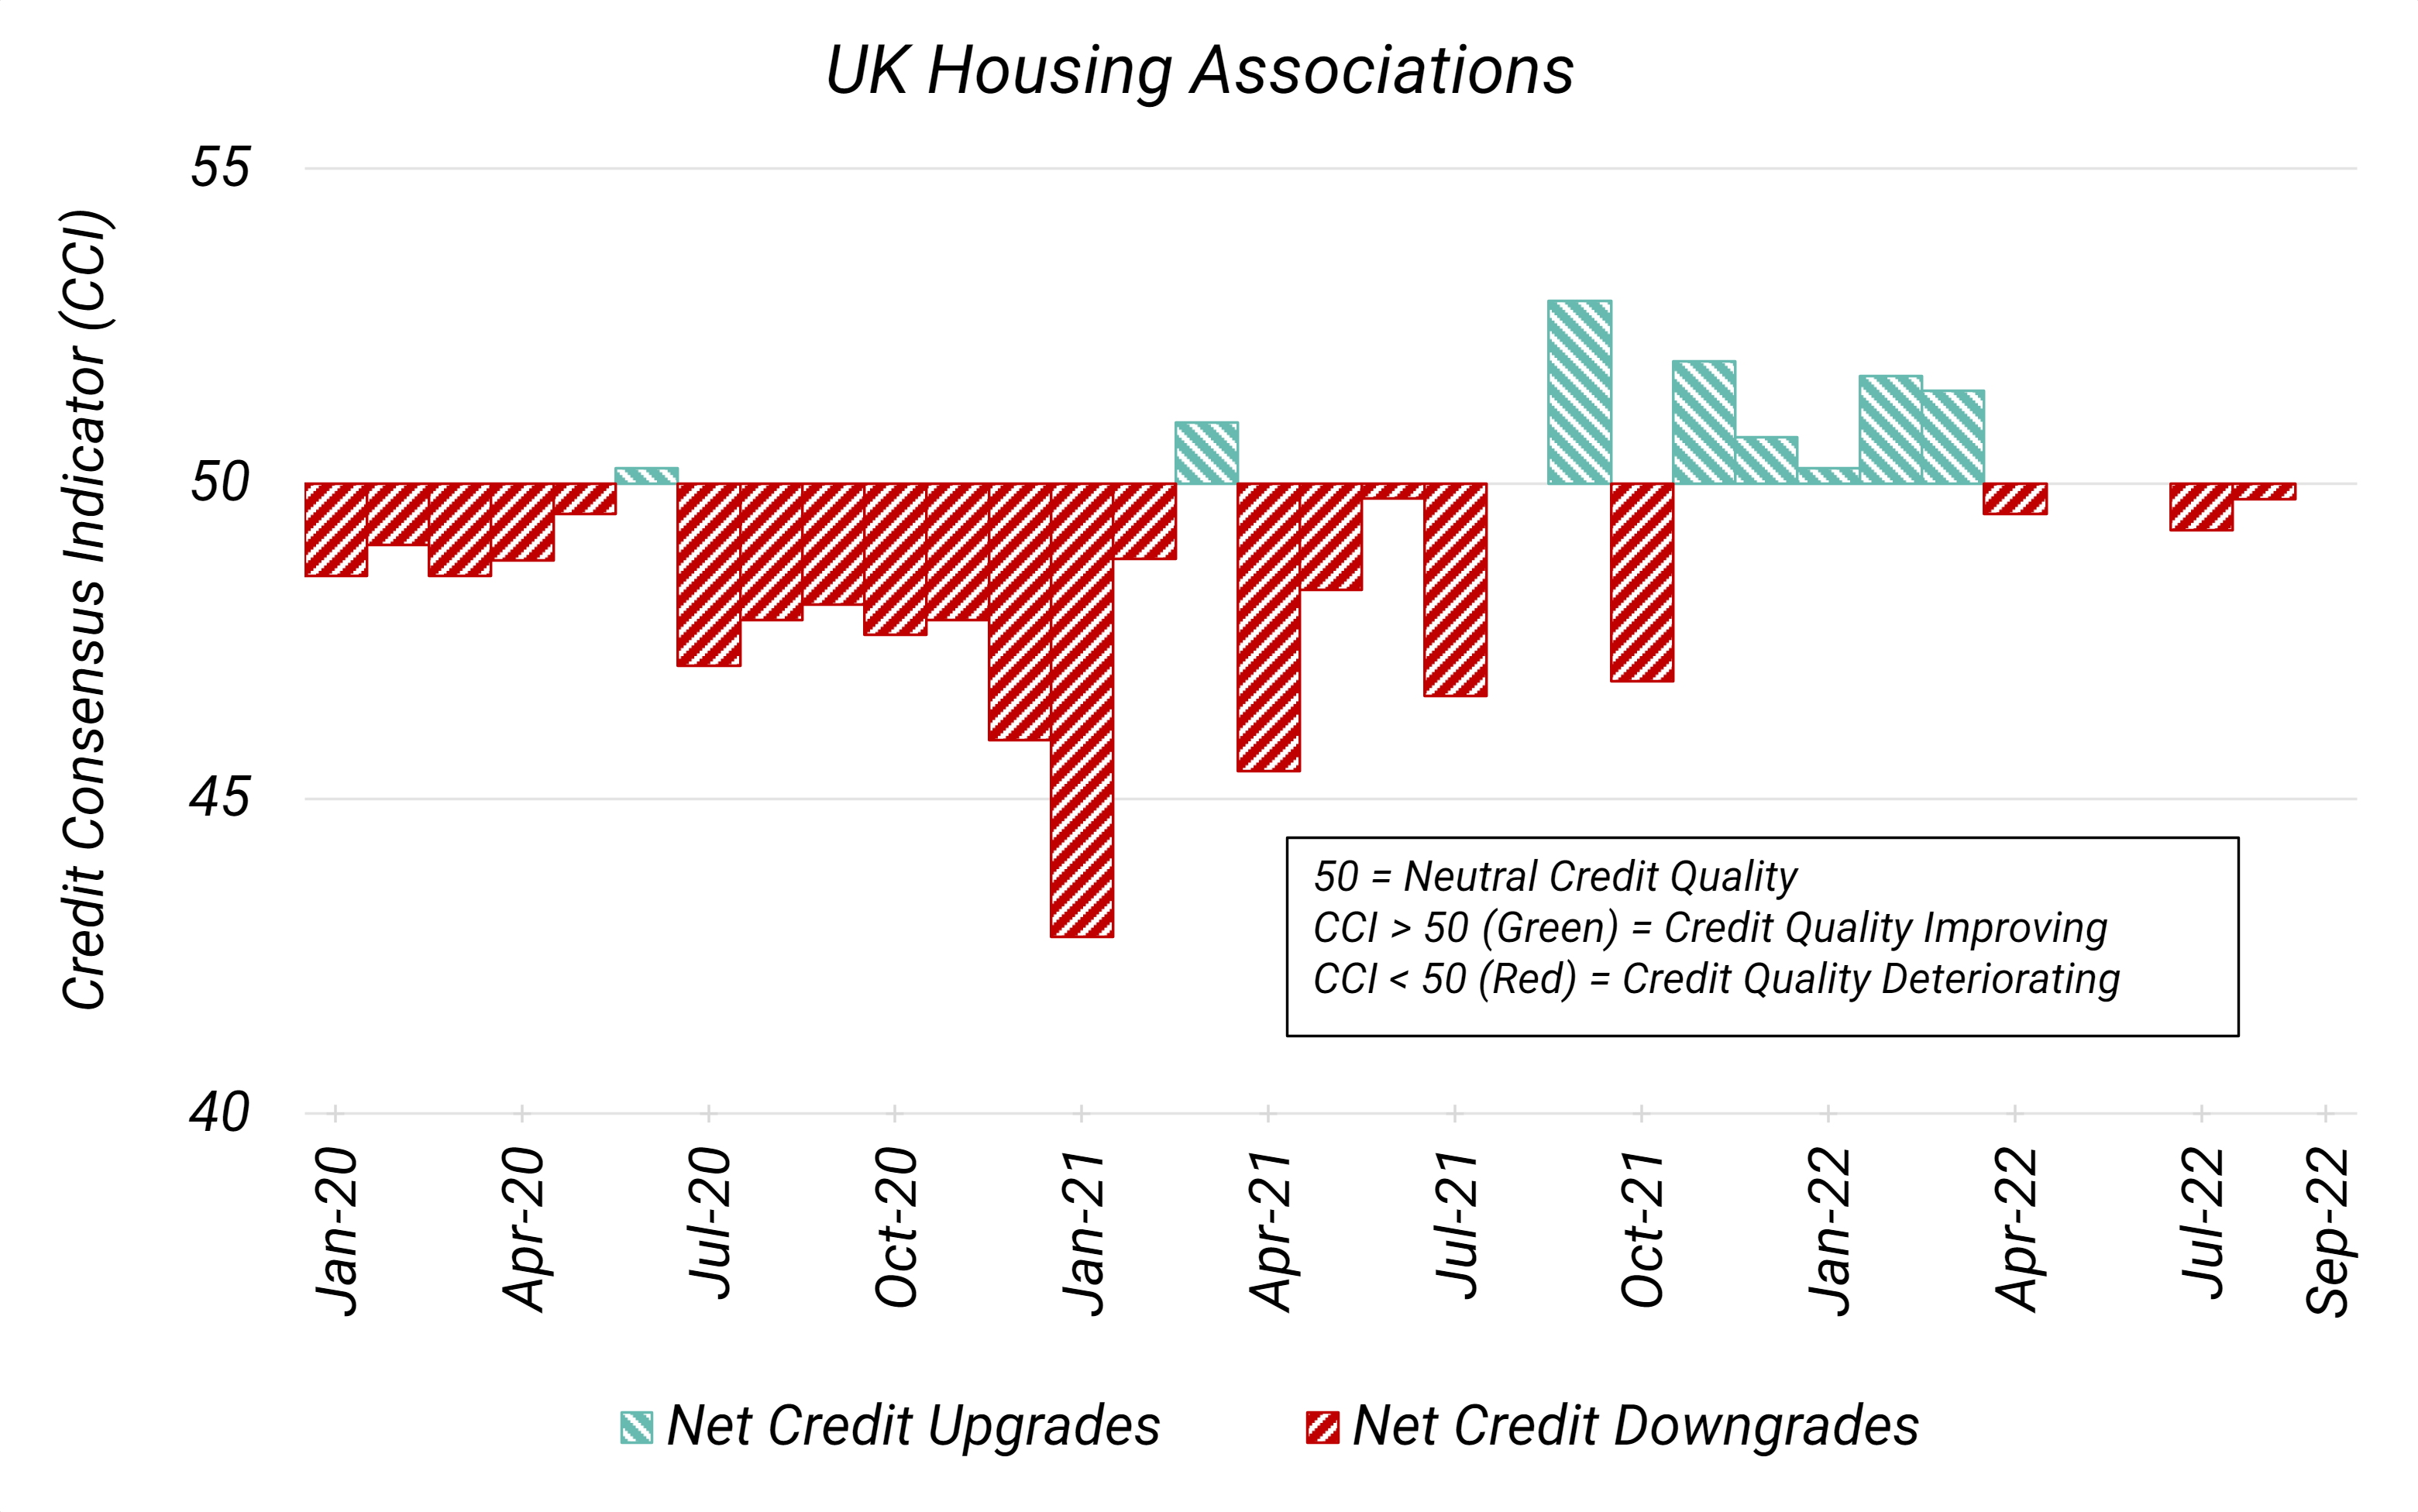
After a run of months of net deterioration in 2020, this sample of more than 400 UK Housing Associations started to consistently record months with a CCI above 50 late last year through to early this year (Nov-21 to Mar-22). However, in more recent months credit movement in UK Housing Associations has been returning to net deterioration, with CCIs below 50 recorded in the last 2 months.
The deterioration of UK Housing Associations is mirrored in Figure 2, showing a long incline in average credit risk – measured by default probability (axis inverted).
Figure 2: Credit Trend, UK Housing Associations; Aug-20 to Aug-22
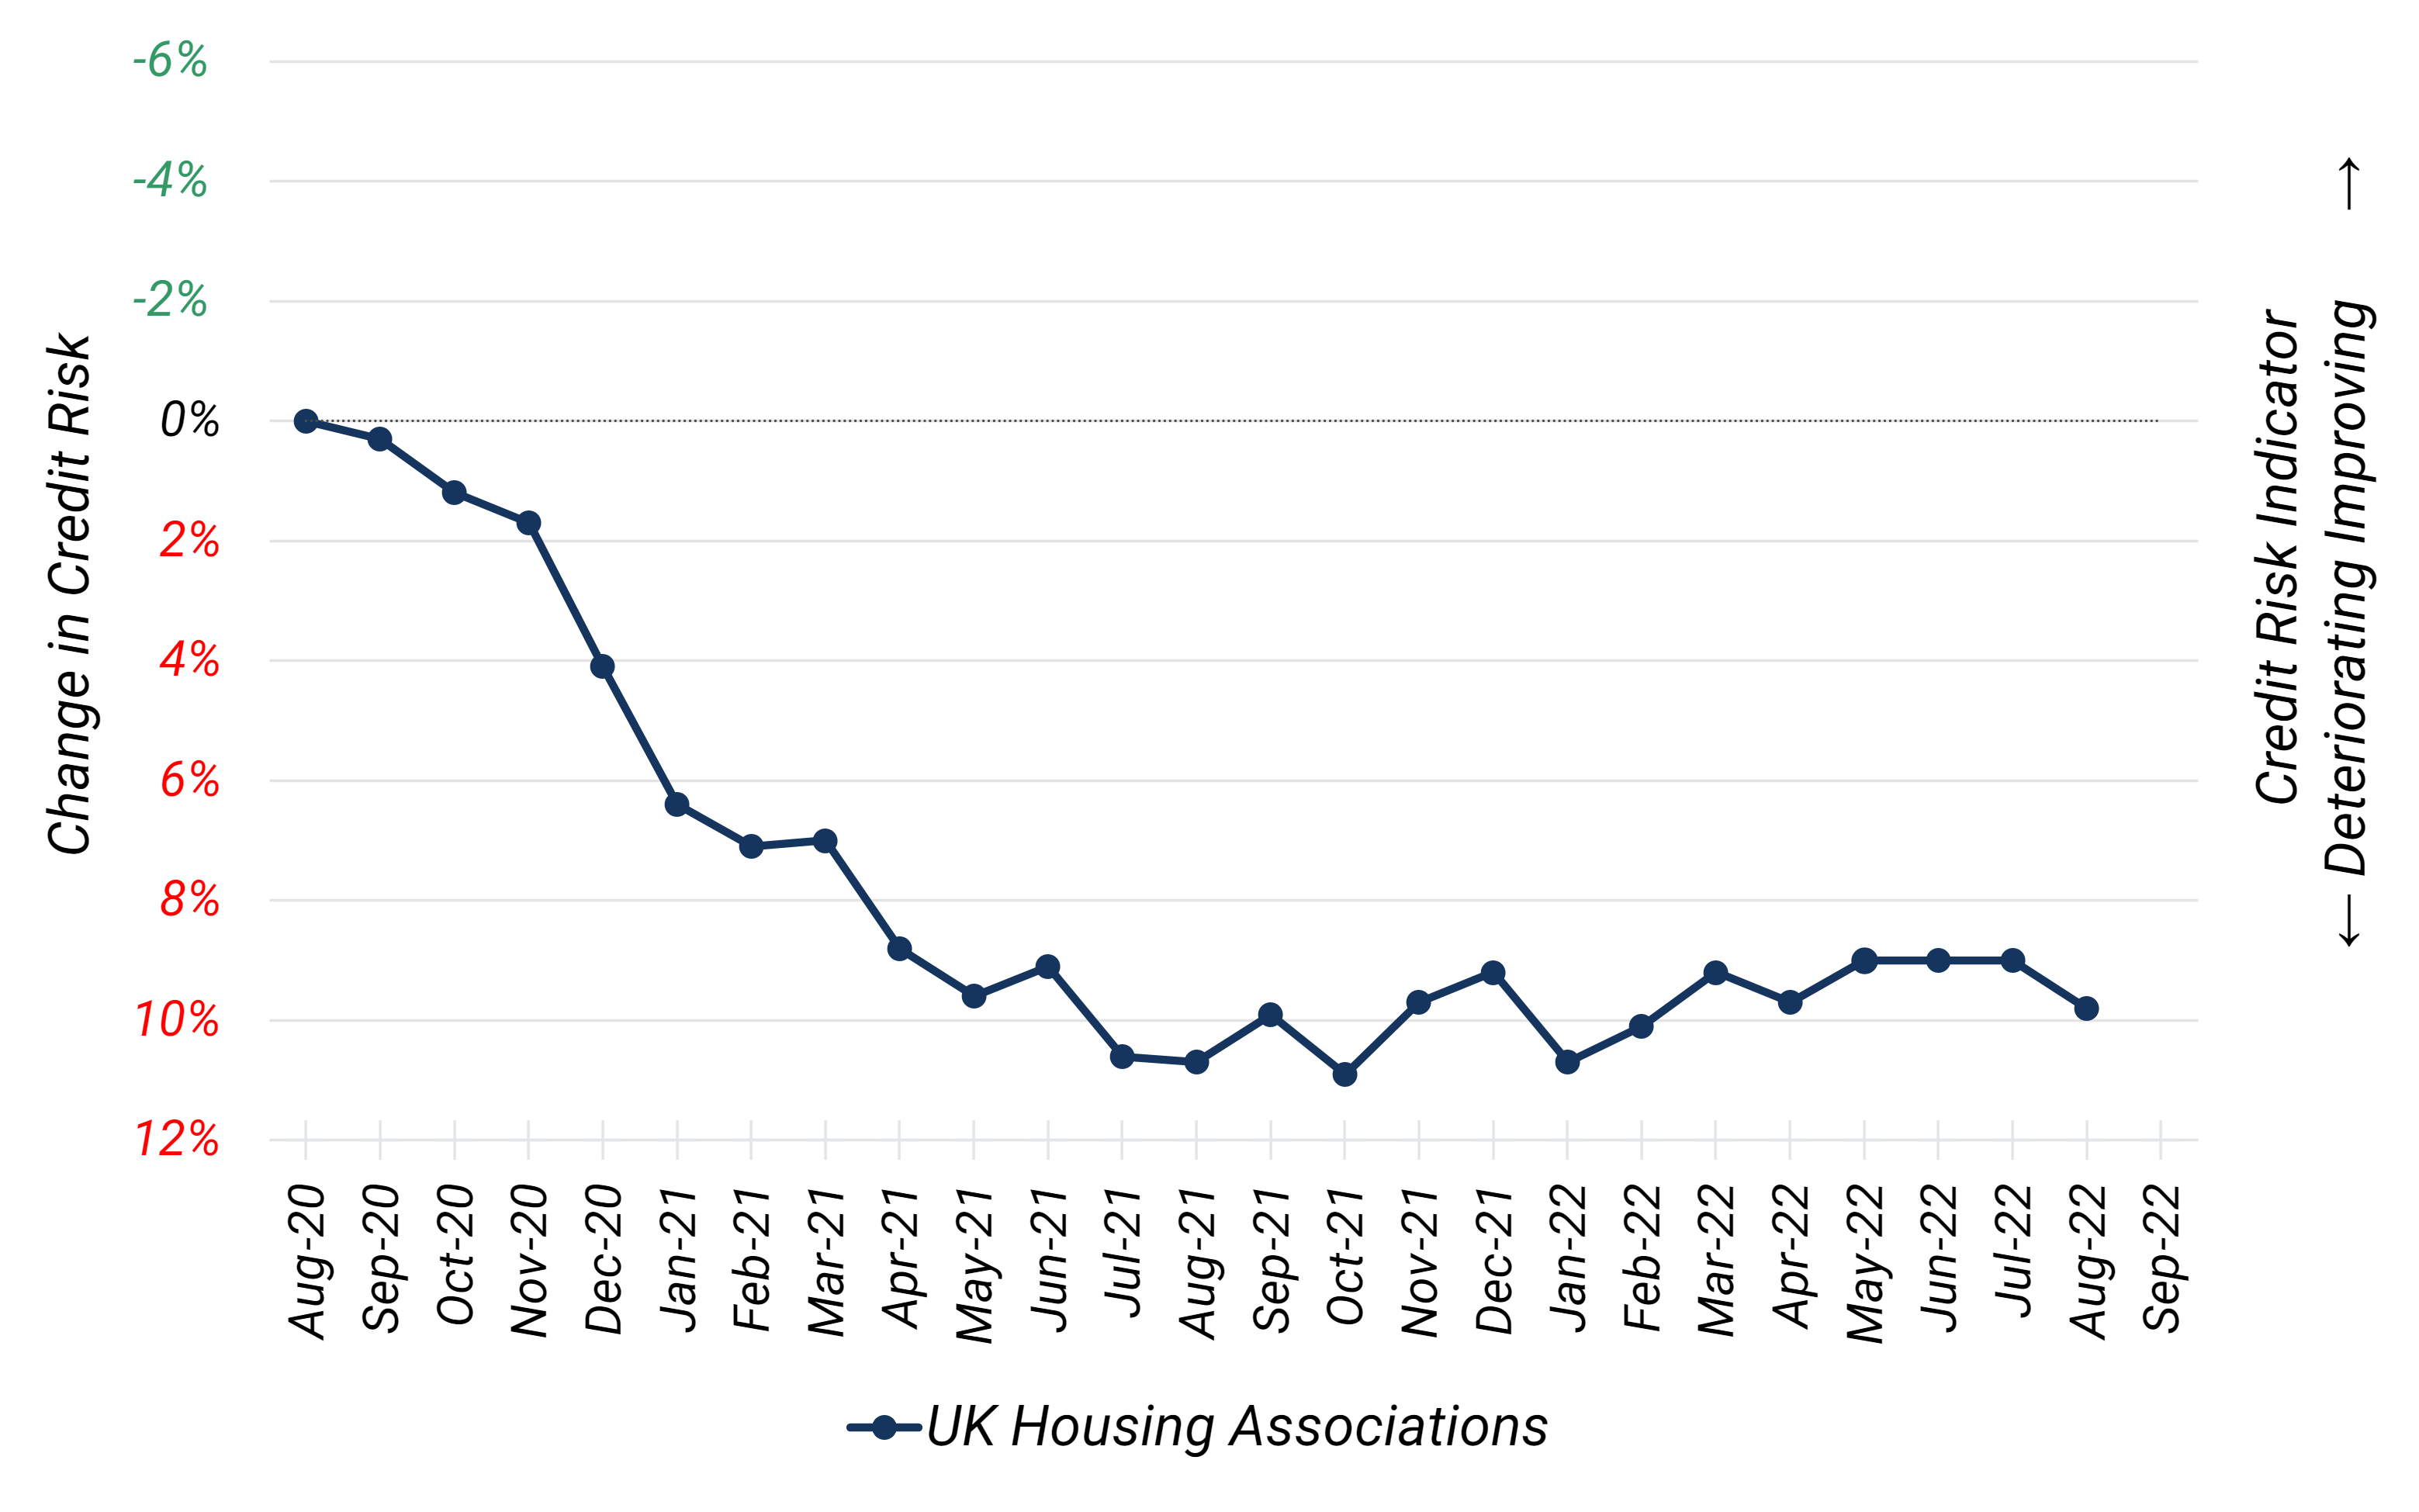
UK Housing Associations Credit Trend graph can be found on the Credit Benchmark Web Application, as a fixed list aggregate.
Figure 3 shows the credit distribution for this sample two years ago compared to current estimates.
Figure 3: Credit Distribution, UK Housing Associations; Aug-20 vs Aug-22
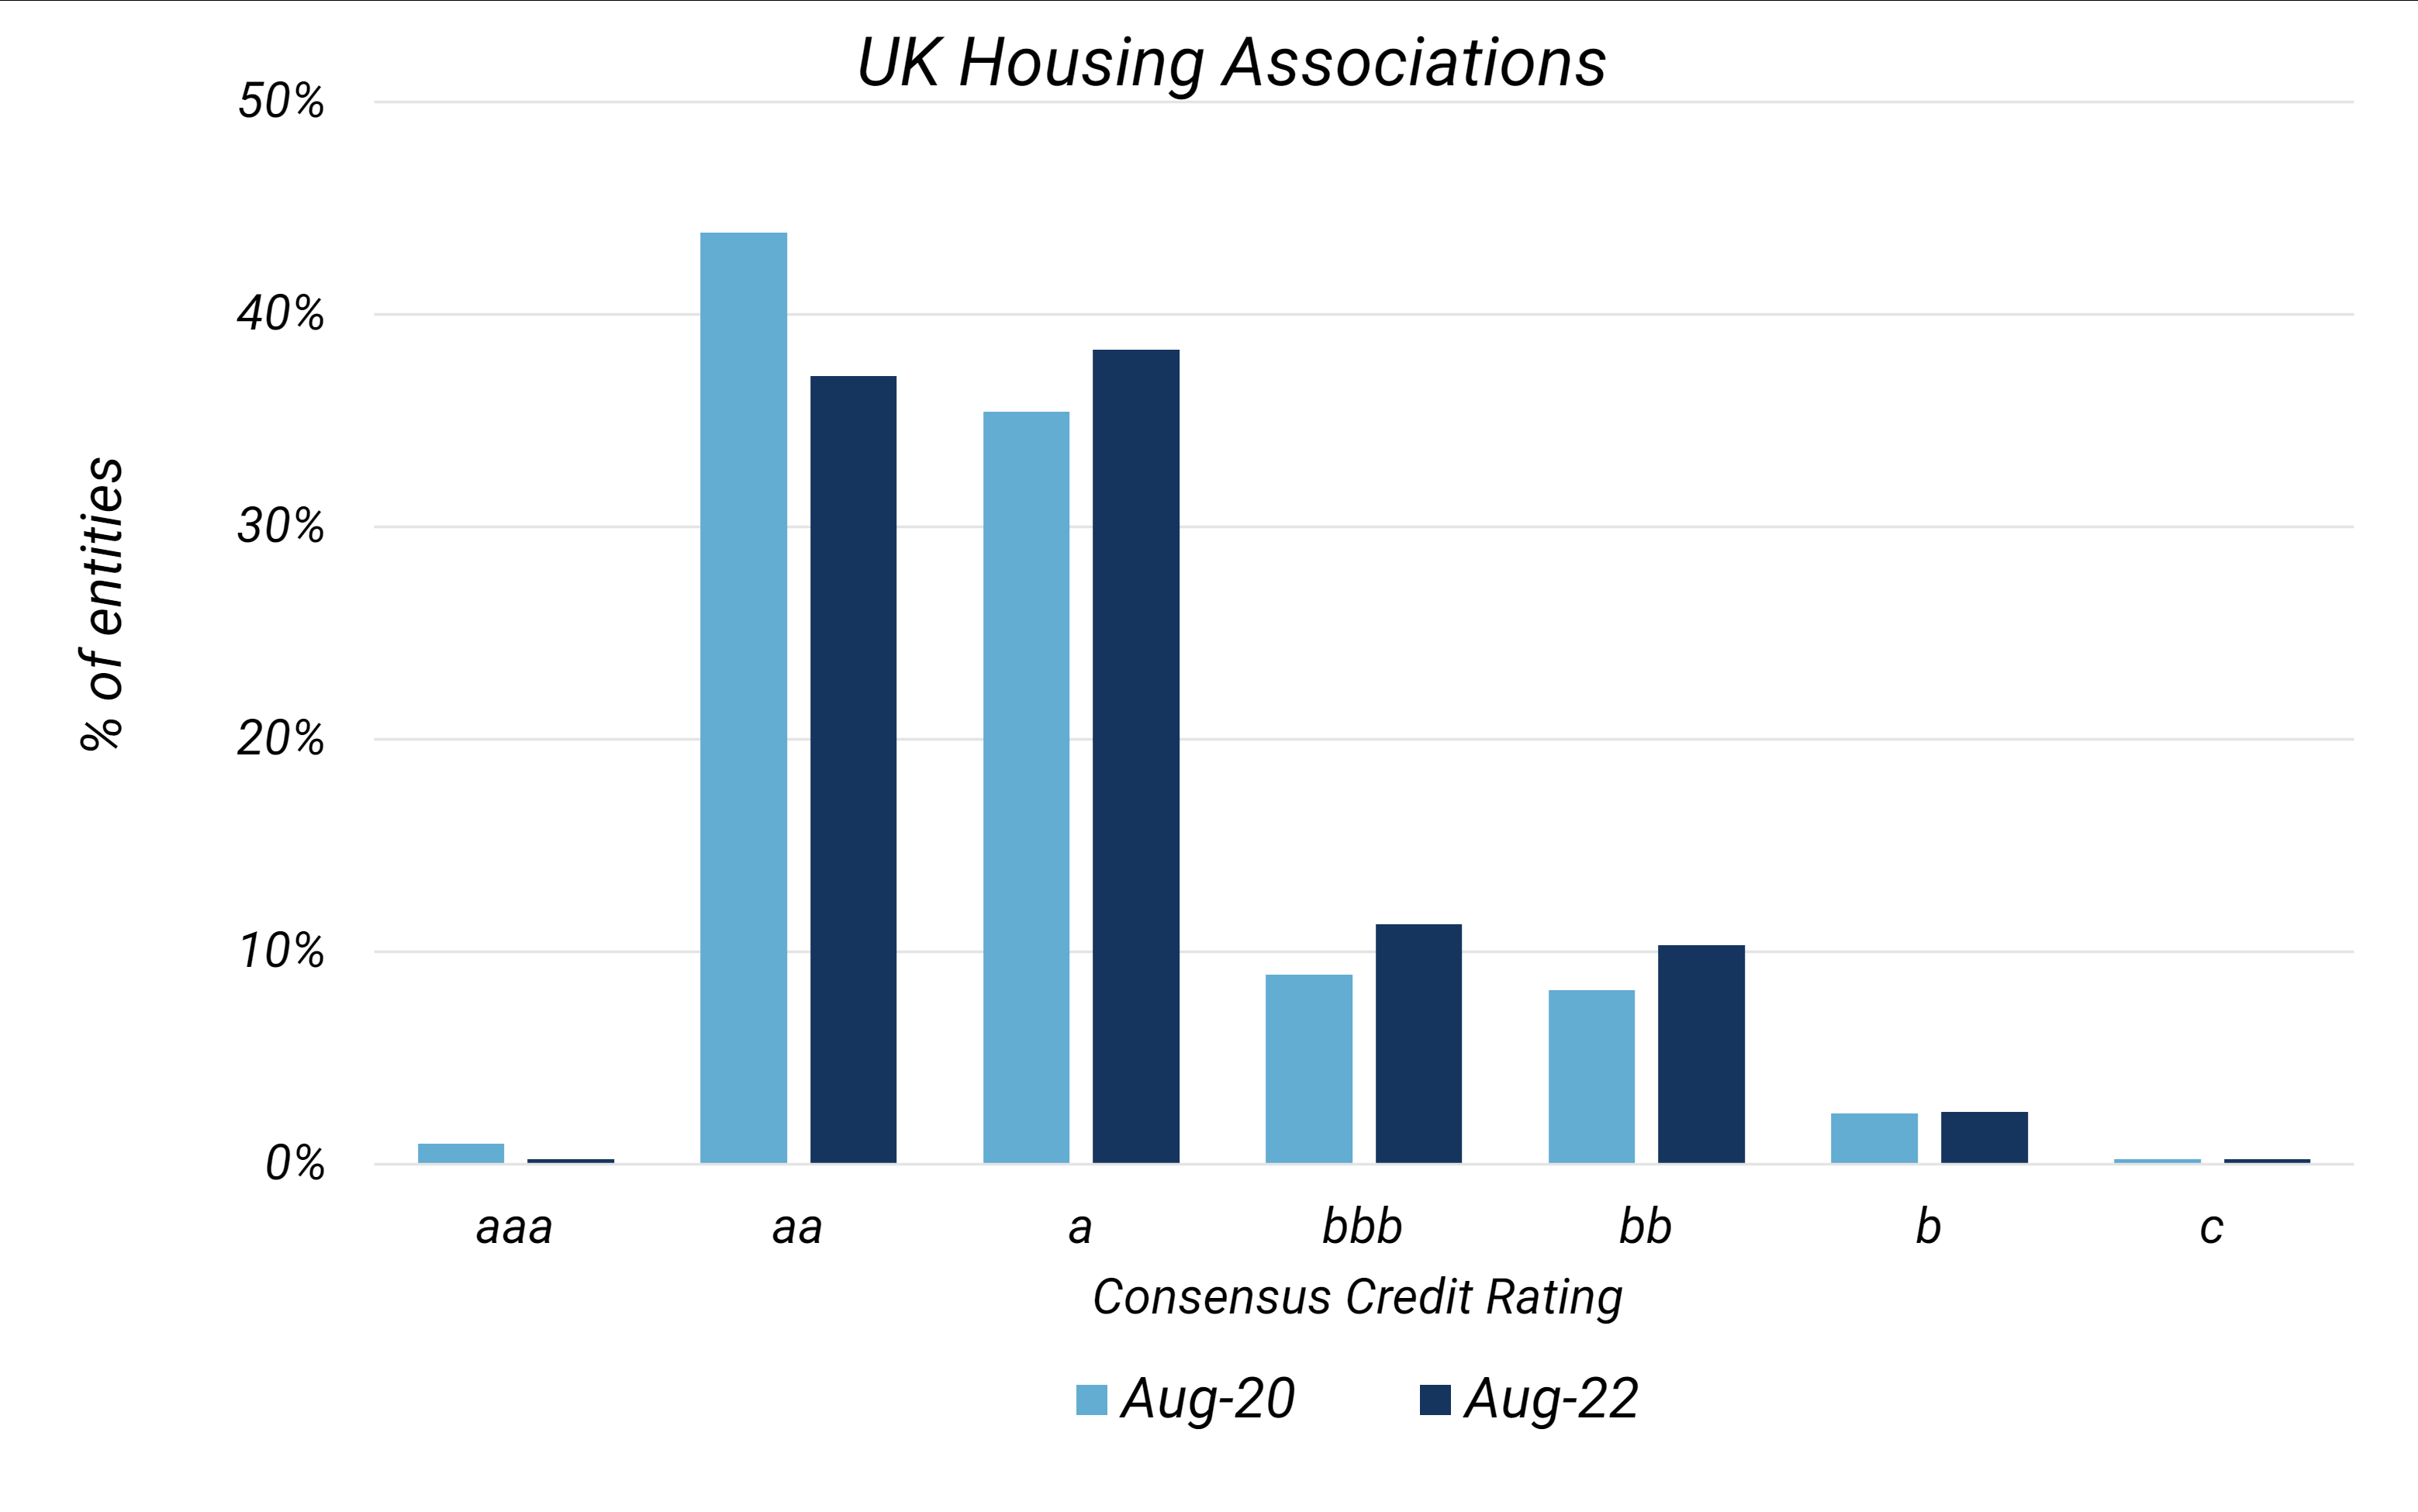
While more than 85% of UK Housing Associations are still investment grade, the credit distribution has shifted to the right over the past two years. There has been a significant decrease in entities with an aa credit category rating, and an increase in the a, bbb and bb.
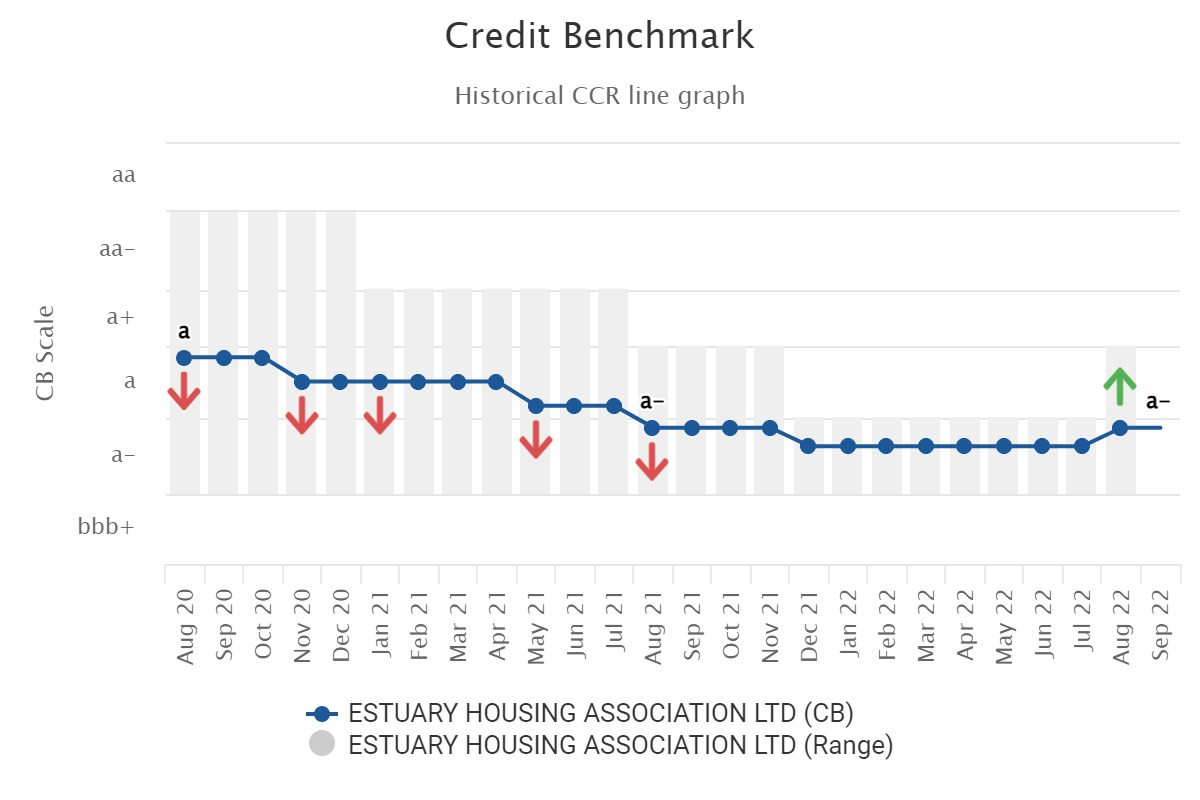
Figures 4-6 show detailed credit trends for various individual UK Housing Associations, some of which have limited CRA coverage.
Figure 4: Longhurst Group LTD
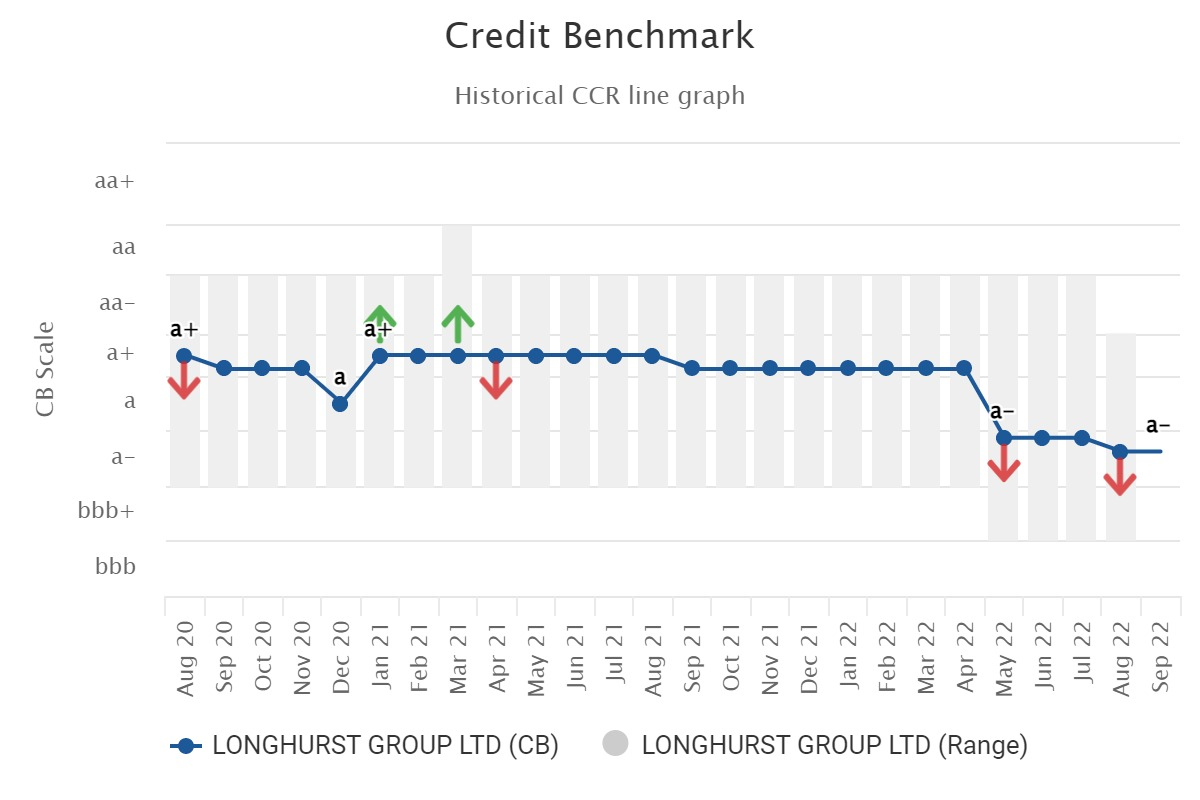
Figure 5: Bedfordshire Pilgrims Housing Association LTD
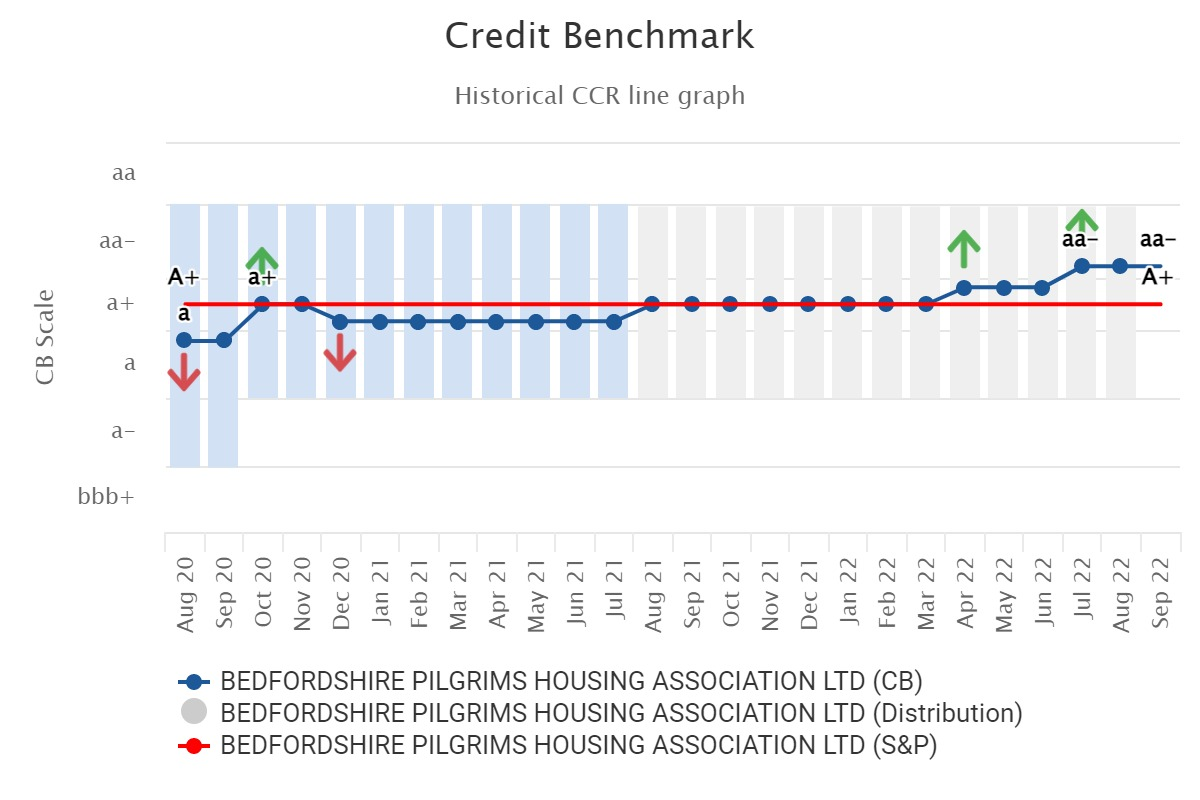
Figure 6: Estuary Housing Association LTD
To learn more about the data behind this article and what Credit Benchmark has to offer, visit https://www.creditbenchmark.com/.


Sign up to receive our stories in your inbox.
Data is changing the speed of business. Investors, Corporations, and Governments are buying new, differentiated data to gain visibility make better decisions. Don't fall behind. Let us help.


Sign up to receive our stories in your inbox.
Data is changing the speed of business. Investors, Corporations, and Governments are buying new, differentiated data to gain visibility make better decisions. Don't fall behind. Let us help.


