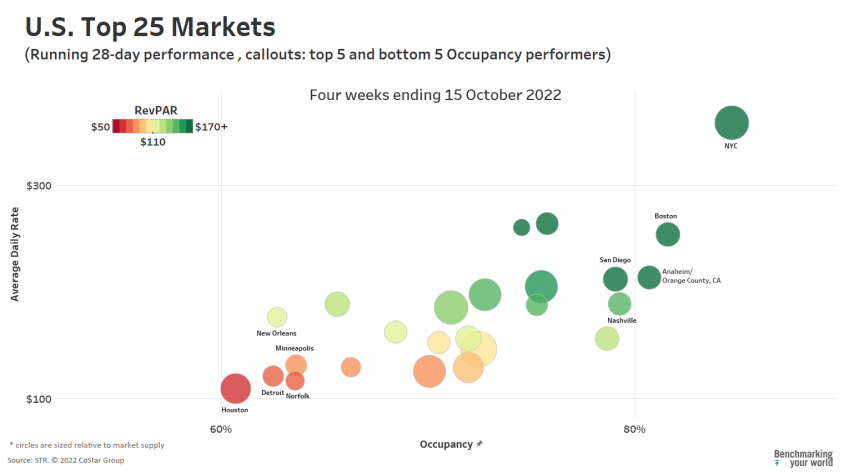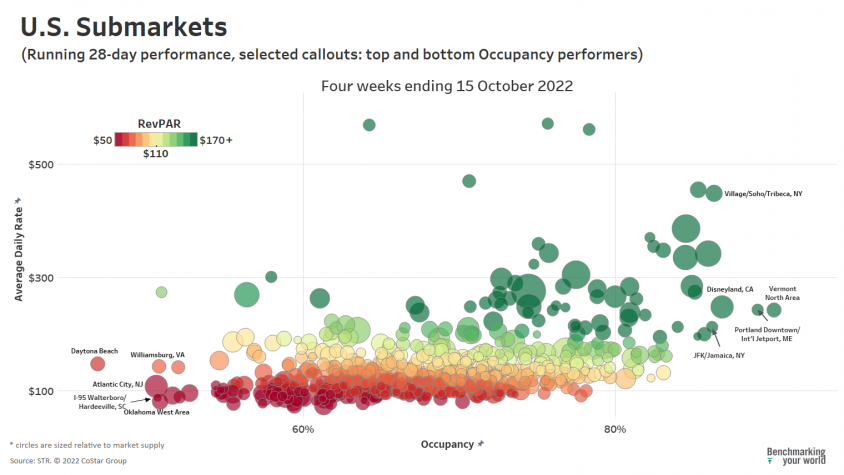
STR’s U.S. “bubble” chart update for mid-October 2022 highlights the best and worst performing hotel markets in terms of occupancy, the average percentage of rooms being filled. Data for the four weeks ending 15 October shows that New York City widened its performance lead over the other large markets and that leisure travelers flocked to autumn destinations as well as resorts far removed from the path of the hurricane.
Among the Top 25 Markets, New York City had the highest occupancy at 84.7%. Boston (81.6%) was second, while Anaheim (80.7%), Nashville (79.3%) and San Diego (79.1%) rounded out the top five. Nashville saw a large month-over-month occupancy jump of 11.1 percentage points, while Anaheim gained 9.1 points from the prior Labor Day-constricted period. Also of note, despite being lower on the occupancy spectrum, New Orleans gained more than 14 points in occupancy (48.6% to 62.7%).
Occupancy levels among the larger markets are still generally below their 2019 comparables. In fact, only three of the Top 25 Markets had higher matched occupancy for the period. In comparison, 55 of the 140 (39%) remaining STR-defined markets outperformed their same-period 2019 comp.
On a revenue-per-available-room (RevPAR) basis, which combines the impacts of average daily rate (ADR) and occupancy, two of the five large market occupancy leaders exceeded their matched 2019 RevPAR after accounting for inflation. San Diego indexed at 115 (or 15% above the 2019 RevPAR) for the recent four weeks, with Anaheim/Orange County indexing at 106. Notable large market deficits in real RevPAR indices occurred in New Orleans (86), Houston (84) and Minneapolis (76).
Geographic details found in STR-defined submarkets hint to a range of factors contributing to top/bottom performance. For one, it remains clear that leisure-oriented travel remains a dominant force within the industry. Outdoor, recreational, and recently, “leaf season” submarkets continued to lead. Vermont North Area (90.2%) and Portland Downtown, ME (89.1%), gained top spots among submarkets, but Disneyland, CA (86.9%), also had a strong four weeks. Rounding out the top five, NYC’s Village/Soho/Tribeca submarket (86.3% occupancy) and JFK/Jamaica (86.2%) excelled in large part due to recent United Nations meetings, which occurred in the second half of September in conjunction with strong Q2-Q3 leisure-oriented weekend travel to the city.
Inflation-adjusted RevPAR indexed against 2019 benchmarks for these top occupancy submarkets ranged from 94 in Village/Soho/Tribeca to 125 in Vermont North Area. In total, 326 or 50% of STR’s 650 reporting submarkets outpaced their 2019 matched-week real RevPAR.
Looking at the bottom performing occupancy submarkets, Hurricane Ian took a negative toll on markets stretching from Florida up the New Jersey seacoast, even in locations not directly affected by the storm. The uncertainty of landfall and poor weather conditions undoubtedly led to a high volume of cancelations and lost business to those markets over the period. As is common in the time after a major storm, certain markets are also seeing a lift in demand as hotels fill with displaced residents, relief workers, insurance adjustors, etc. See STR’s Market Recover Monitor blog for 1 October and 8 October for further analysis of the impacts of Hurricane Ian.


To learn more about the data behind this article and what STR has to offer, visit https://str.com/.


Sign up to receive our stories in your inbox.
Data is changing the speed of business. Investors, Corporations, and Governments are buying new, differentiated data to gain visibility make better decisions. Don't fall behind. Let us help.


Sign up to receive our stories in your inbox.
Data is changing the speed of business. Investors, Corporations, and Governments are buying new, differentiated data to gain visibility make better decisions. Don't fall behind. Let us help.


