
Overview
Welcome to the November 2022 Apartment List National Rent Report. Our national index fell by 0.7 percent over the course of October, marking the second straight month-over-month decline, and the largest single month dip in the history of our index, going back to 2017. These past two months have marked a rapid cooldown in the market, but the timing of that cooldown is consistent with a seasonal trend that was typical in pre-pandemic years. Going forward it is likely that rents will continue falling in the coming months as we enter the winter slow season for the rental market.
Despite the monthly decline, rent growth over the course of this year continues to outpace the pre-pandemic trend, even as it has slowed significantly from last year’s peaks. So far in 2022 rents are up by a total of 5.9 percent, compared to 18 percent at this point in 2021. Year-over-year growth has decelerated rapidly since the start of the year, but it’s still likely that 2022 will end up being the second fastest year of rent growth since the start of our estimates.
The cooldown in rent growth is being mirrored by continued easing on the supply side of the market. Our vacancy index now stands at 5.5 percent, after a full year of gradual increases from a low of 4.1 percent last fall. In the past two months, this easing of the vacancy rate has picked up steam again, after plateauing a bit over the summer. That said, today’s vacancy rate remains below the pre-pandemic norm.
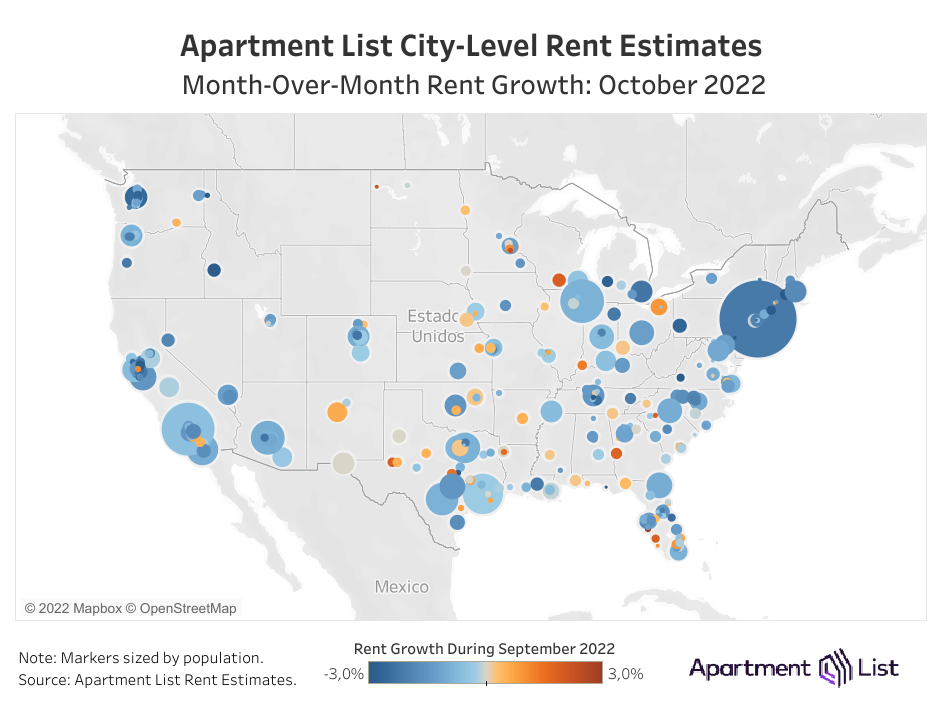
The recent slowdown has been geographically widespread. Rents decreased this month in 89 of the nation’s 100 largest cities in October. Boise, ID – one of the first rental markets to explode in the early phases of the pandemic – saw the sharpest rent decline among the nation’s 100 largest cities this month (-3.5 percent). At the metro level, we are continuing to see an ongoing cooldown in many of the recently booming Sun Belt markets. Las Vegas, Phoenix, Jacksonville, and Riverside have all seen rent growth of more than 30 percent since March 2020, but none of these metros has seen rents increase by more than 2 percent over the past twelve months.
Rents nationally fall by 0.7% month-over-month; rents still up 5.7% year-over-year
The national median rent increased by a record-setting 17.6 percent over the course of 2021. This rapid growth in rent prices is a key contributor to overall inflation, which is currently rising at its fastest pace in 40 years. With inflation top-of-mind for policymakers and everyday Americans alike, our rent index is particularly relevant, since movements in market rents lead movements in average rents paid. As a result, our index can signal what is likely ahead for the housing component of the official inflation estimates produced by the Bureau of Labor Statistics. Thankfully for the country’s renters, our national rent index has shown month-over-month growth decelerating quickly in recent months. In fact, for the past two months, our index has actually been declining.
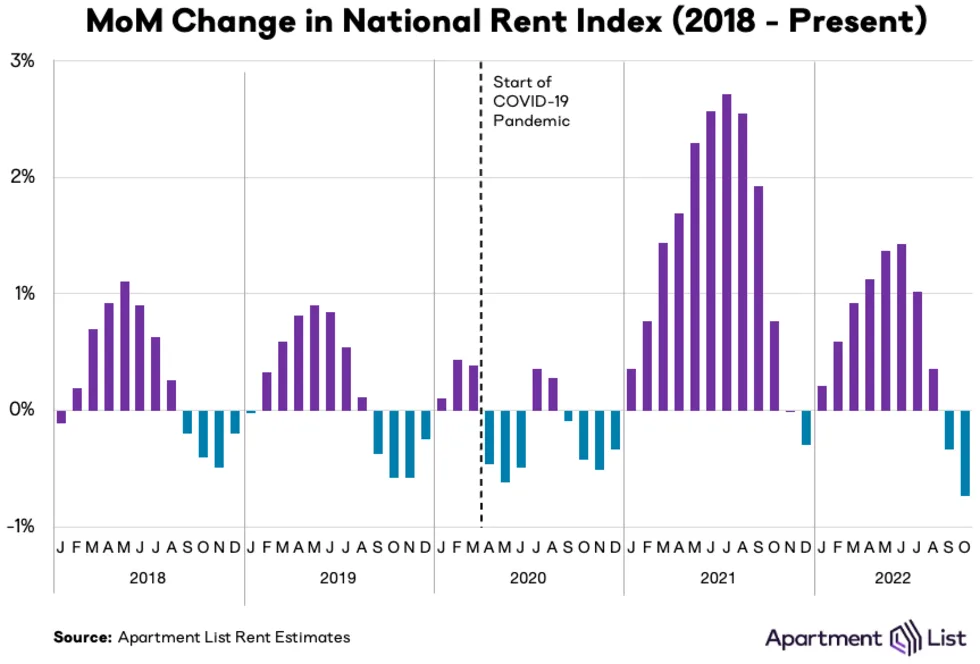
We estimate that the national median rent fell by 0.7 percent month-over-month in October. This is the largest monthly decline in the full history of our index, which starts in January 2017. Our national rent index has now declined for two straight months, and is down by 1.1 percent since August. A modest decline in rents at this time of year is consistent with the normal seasonal trend that we typically see in our rent index. But given how atypical the market has been for the past two and a half years, this return to pre-pandemic seasonality represents a notable shift. Last October, rents increased by 0.8 percent month-over-month, as the market continued on an unprecedented stretch of record-setting rent growth which disrupted seasonal trends. In contrast, this October’s record-setting decline marks a rapid cooldown which may signal that we’re entering a new phase of the rental market rollercoaster. It’s likely that rents will decline further in the months ahead, as rental market activity slows during the winter months.
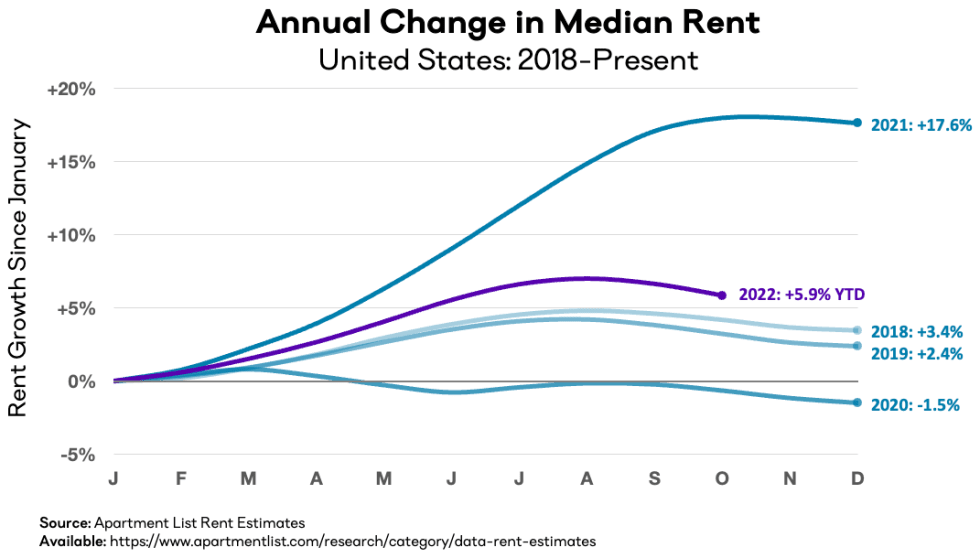
It should still be noted that even as the market cools, rents growth in 2022 is still trending faster than in pre-pandemic years. From January through October of this year, our national rent index has increased by a total of 5.9 percent. Although this is far below the 18 percent increase that took place during the same months of last year, this year’s pace still remains notably faster than the years prior to 2021. For comparison, rent growth from January to October totalled 4.2 percent in 2018, 3.2 percent in 2019, and -0.6 percent in 2020. Unless rents fall even more sharply over the next two months, 2022 will likely end up being the second fastest year of rent growth in our data, going back to 2017.
As rent growth slows, vacancies ease
As we’ve explored in detail, much of the 2021 rent boom was attributable to a tight market in which more households were competing for fewer vacant units. Our vacancy index spiked above 7 percent in the early months of the pandemic in 2020, as many Americans consolidated households and moved in with family amid the uncertainty and economic disruption of the pandemic’s onset. After that, however, rapid household formation drove a sharp tightening of the vacancy rate, which eventually fell to a low of 4.1 percent last fall.
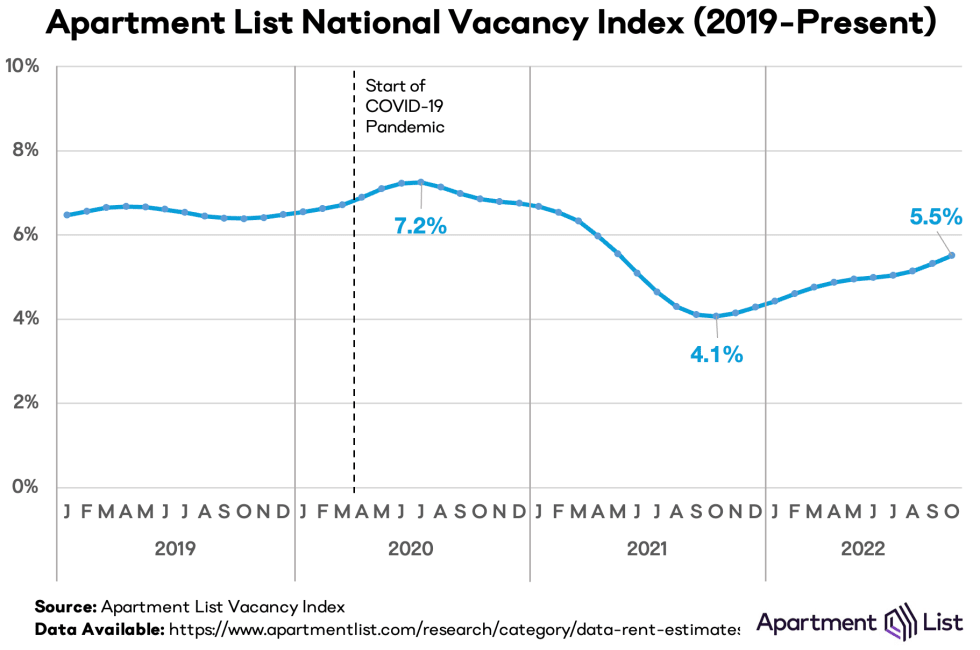
But after bottoming out at 4.1 percent in October 2021, our national vacancy index has been on a trend of gradual easing. As of this month, it has now shown a full year of continued, albeit slow, improvements. In fact, the pace at which the vacancy rate is easing has been picking up a bit of steam in recent months, as rent growth has turned negative. From April through August, our vacancy index ticked up by just 0.2 percentage points, from 5.1 percent to 5.3 percent. But from August through October, it has increased by 0.4 percentage points, hitting 5.5 percent this month. After a prolonged period of skyrocketing rent growth, and with non-housing related costs also getting more expensive as a result of broad-based inflation, it seems that some Americans are moving back in with family or roommates, or delaying striking out on their own. This slowing household formation is driving the cooldown that we are seeing on both the demand and supply sides of the market.
Vacancy trends are highly localized, and they played a major role in determining how quickly rent inflation affected cities throughout the pandemic. To explore the topic in greater detail, monthly vacancy data are now available for download for hundreds of cities, metros, and states, and can be easily linked to our existing rent estimates using Federal Information Processing System (FIPS) codes.
Rents fall month-over-month in 89 of 100 largest cities
The chart below visualizes monthly rent changes in each of the nation’s 100 largest cities from January 2019 to present. The color in each cell represents the extent to which prices went up (red) or down (blue) in a given city in a given month. In 2020, we can see that rents fell sharply in many of the nation’s largest and most expensive cities, while smaller and more affordable ones picked up steam, leading to some convergence in prices. Meanwhile, the dark red band in 2021 depicts last year’s rent heatwave, which peaked in July and August 2021 when all 100 cities in this chart saw prices go up. The rightmost columns show that the recent cooldown has also been geographically widespread.
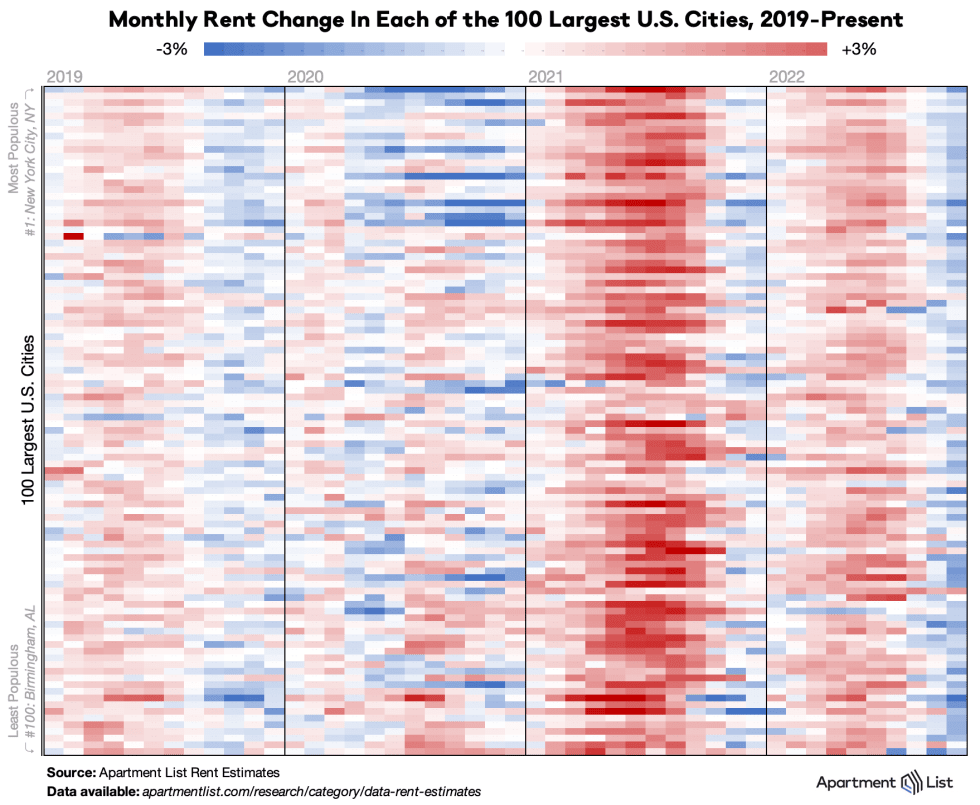
Rents decreased this month in 89 of the nation’s 100 largest cities, while an additional two cities saw rents hold steady, and only nine cities saw increases. And nearly across the board, local rent growth has cooled down since last year – 96 of the top 100 cities have seen slower year-to-date rent growth in 2022 than they did over the same months of 2021. The largest city-level decline this month was in Boise, ID, where rents fell by 3.5% from September to October. Boise was an early poster child for pandemic-era rent disruption. Prices there peaked in August of last year, with rents up by a staggering 46.5 percent from their March 2020 level. In the time since, however, the market there has cooled off, and prices are now up 36.6 percent compared to the March 2020 baseline. Pittsburgh, Seattle, Detroit, and New York City round out the top five sharpest month-over-month declines, with each seeing prices fall by more than 2 percent this month.
Midwest markets picking up steam
Major markets throughout the Sun Belt have experienced truly disruptive levels of rent growth since the start of the pandemic, but over the past six months, the fastest growth has actually been occurring in the Midwest. The following table shows the ten metropolitan areas that have experienced the fastest rent growth over the past six months, over the past year, and since the pandemic started in March 2020:
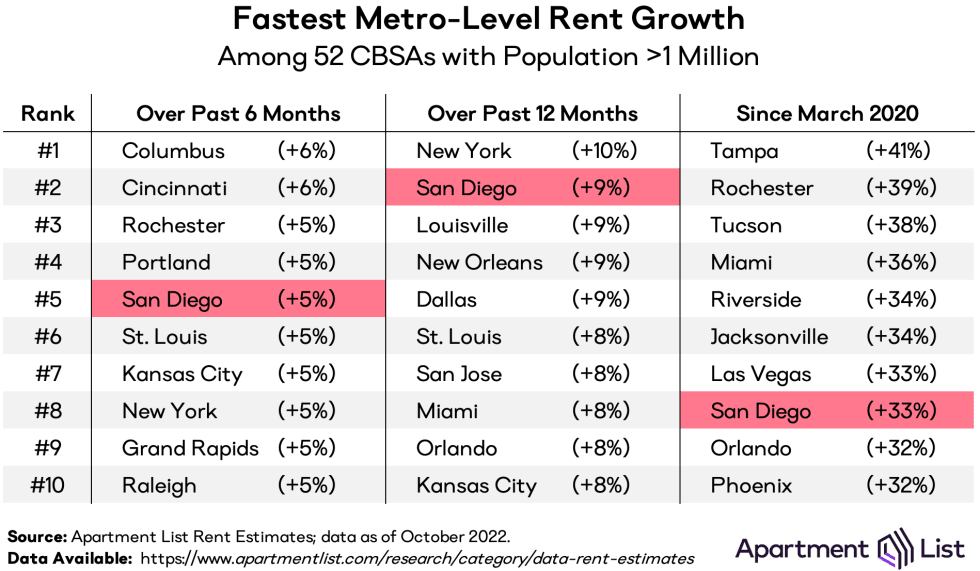
The six month column is topped by two Ohio metros – Columbus and Cincinnati – while St. Louis, Kansas City, and Grand Rapids all also land within the top ten. With many previously affordable Sun Belt markets having seen rents spike by 30 percent or more over the past two and a half years, markets in the Midwest may now represent some of the last bastions of affordability, and could therefore be drawing new attention.
Over the past year, the New York City metro has seen the nation’s fastest growth. But it’s notable that even in the hottest markets, growth rates are cooling quickly. Currently, New York is the only metro that has experienced double digit rent growth over the past twelve months. In contrast, as recently as July, 36 of the 52 metros with a population over one million had year-over-year growth rates above 10 percent.
Some booming Sun Belt markets have plateaued
The San Francisco metro experienced the sharpest rent declines in the first year of the pandemic, and has been the slowest market to recover in the time since then. It now looks as if this sluggishness could be set to continue with a seasonal slowdown. Metro-wide, Bay Area rents fell by 1.1 percent in October and are down by 1.9 percent since August, both figures representing a sharper cooldown than the national average. This dip has brought the metro’s median rent back slightly below its March 2020 level. And at the city-level, some markets in the San Francisco Bay Area are recovering even more slowly, particularly in the more densely populated core cities. In Oakland, rents are still down 12.2 percent compared to March 2020 – the biggest discount among the 100 largest cities – while in San Francisco proper, rents are still down 9.7 percent.
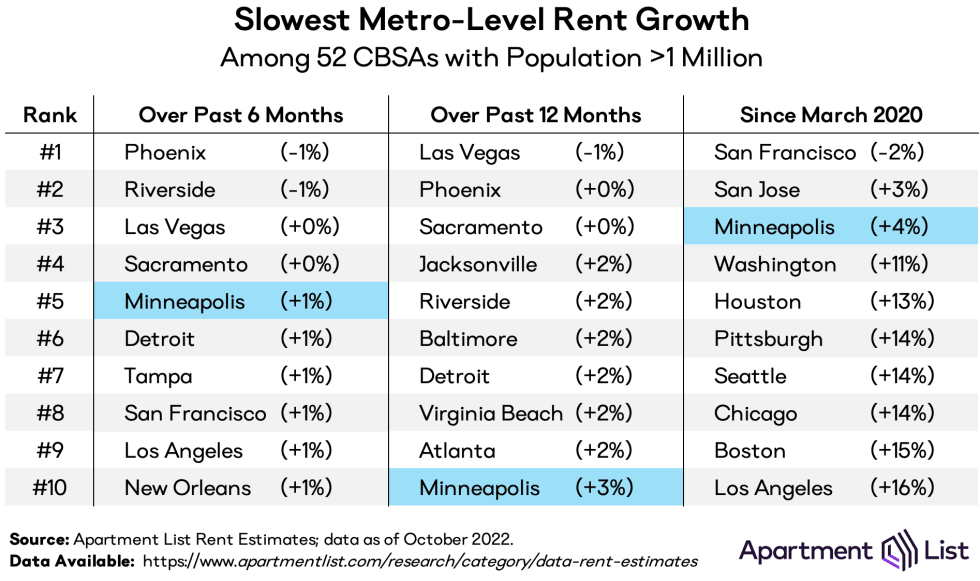
After San Francisco the right-most column of the table is largely populated by other pricey coastal metros, including San Jose; Washington, D.C.; Seattle; Boston; and Los Angeles. Even as many of these markets have been heating up recently, they have still had among the most modest rent growth over the course of the pandemic as a whole. That said, just three metros have experienced rent growth of less than 10 percent over the past two and a half years.
Notably, the table above also shows how some of the markets that had been booming fastest are now showing signs of cooling off. For example, over the past year, the median rent in Las Vegas is down by 1 percent and in Phoenix prices have been flat, despite the fact that both metros rank among the top ten for fastest pandemic-era rent growth, with increases of more than 30 percent since March 2020. Jacksonville and Riverside similarly rank in the top 10 for both fastest growth since March 2020 and slowest growth over the past year. And in the Tampa metro, which has seen the single largest rent increase since the start of the pandemic (+41 percent), prices are up by just 1 percent over the past six months, the sixth slowest increase over that period. After booming consistently for two years, these markets are finally beginning to plateau.
Conclusion
Rent prices have dipped nationally for two straight months, and October’s 0.7 percent decline represents a record in our data. Growth over the course of the year as a whole continues to pace ahead of pre-pandemic trends, but we’re now seeing a marked shift in market conditions, with prices cooling and supply constraints continuing to abate. In the winter months ahead, we expect rental activity will continue to slow and we are likely to see continued modest price decreases to close out the year. That said, we’re still on pace to end 2022 with full year rent growth exceeding any year from 2017 to 2020.
To learn more about the data behind this article and what Apartment List has to offer, visit https://www.apartmentlist.com/.


Sign up to receive our stories in your inbox.
Data is changing the speed of business. Investors, Corporations, and Governments are buying new, differentiated data to gain visibility make better decisions. Don't fall behind. Let us help.


Sign up to receive our stories in your inbox.
Data is changing the speed of business. Investors, Corporations, and Governments are buying new, differentiated data to gain visibility make better decisions. Don't fall behind. Let us help.