×
The email you entered is not valid.
Business

Black Friday Statistics You Need to Know (2022)

Source: https://www.similarweb.com/corp/blog/ecommerce/retail-insights/black-friday-stats-trends/

Black Friday.

It’s a word pairing capable of producing an almost Pavlovian response. Simply hearing its name in the wind can have us reaching for our wallets, pulling out our credit cards, and making a beeline for that “Buy Now” button.

And it’s almost here. Yep – the seductive siren song of Black Friday is back for another year on November 25, ready to lure bargain-hungry consumers back into the arms of its irresistible discounts.

Below, you’ll find everything you need to know about Black Friday statistics, from 2020 and 2022 through to Black Friday’s history.

And what does this year have in store? We’ll tell you using data from Similarweb’s unique data, providing insights on traffic, trends, and shopper behavior.

Data trends from 2020-2021

Black Friday statistics 2020

  1. Shoppers spent $6.3 million per minute online, at an average of $27.50 per person.
  2. Amazon’s product views were up 8% and purchases up 18% from the year before. (Source: Similarweb Shopper Intelligence)
  3. Traffic to affiliate site blackfriday.com increased 96% last year. During the holiday period, walmart.com received one in every three clicks from blackfriday.com. (Source: Similarweb)
  4. Purchases on smartphones accounted for 40% of all online spending. (Source: Adobe)
  5. Amazon’s conversion rates grew to 9.6% and revenue soared to $34.5 billion.

Black Friday Statistics 2021

  1. According to NRF about 155 million Americans shopped, of which about 88 million shoppers made online purchases.
  2. Adobe Digital Insights reported that Black Friday sales in the US came down from about $9 billion in 2020 to about $8.9 billion in 2021.
  3. Deloitte found that while overall sales decreased, the average spend per person increased about 5% from 2020 to 2021, going from about $410 per shopper to $430.
  4. Desktop computers tend to have the highest conversion rate (6.9%) when compared to tablets (4.8%) and smartphones (2.9%). (Source: Adobe Analytics)
  5. Free shipping was the biggest factor (49%) influencing buyer decision-making, ahead of promotions and limited-time sales (36%), and an intuitive website or app (21%). (Source: National Retail Federation)
  6. There was a 15% YoY decrease in Black Friday sales, when compared to 2020, as online shopping was no longer the only option during the holiday event. (Source: Similarweb)
  7. Large brands artificially inflated their prices prior to Black Friday in order to offer “bigger” discounts. Prices for Amazon’s 46 top-selling beauty products were 28% higher during the 17 days prior to Black Friday than August-October. (Source: Similarweb)

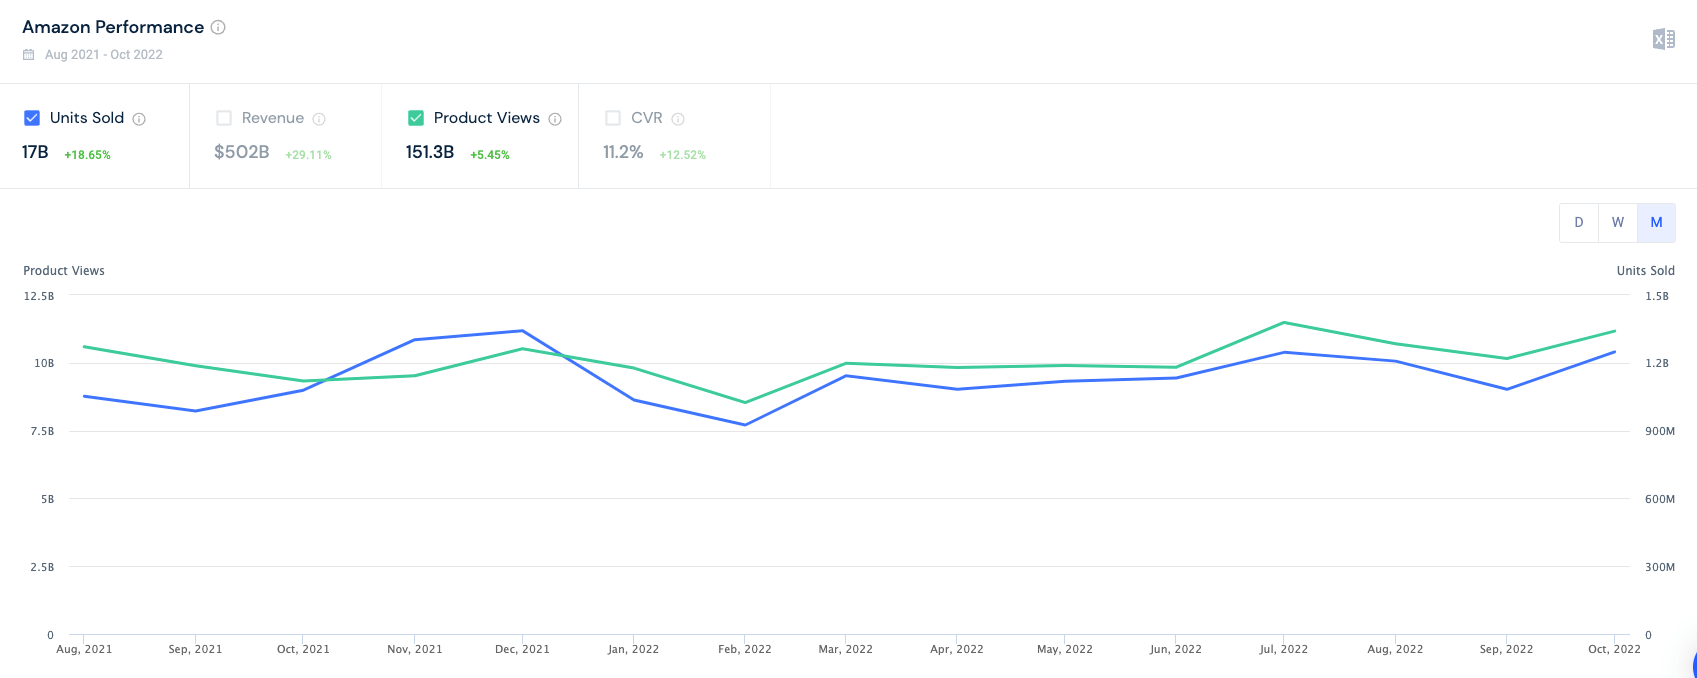
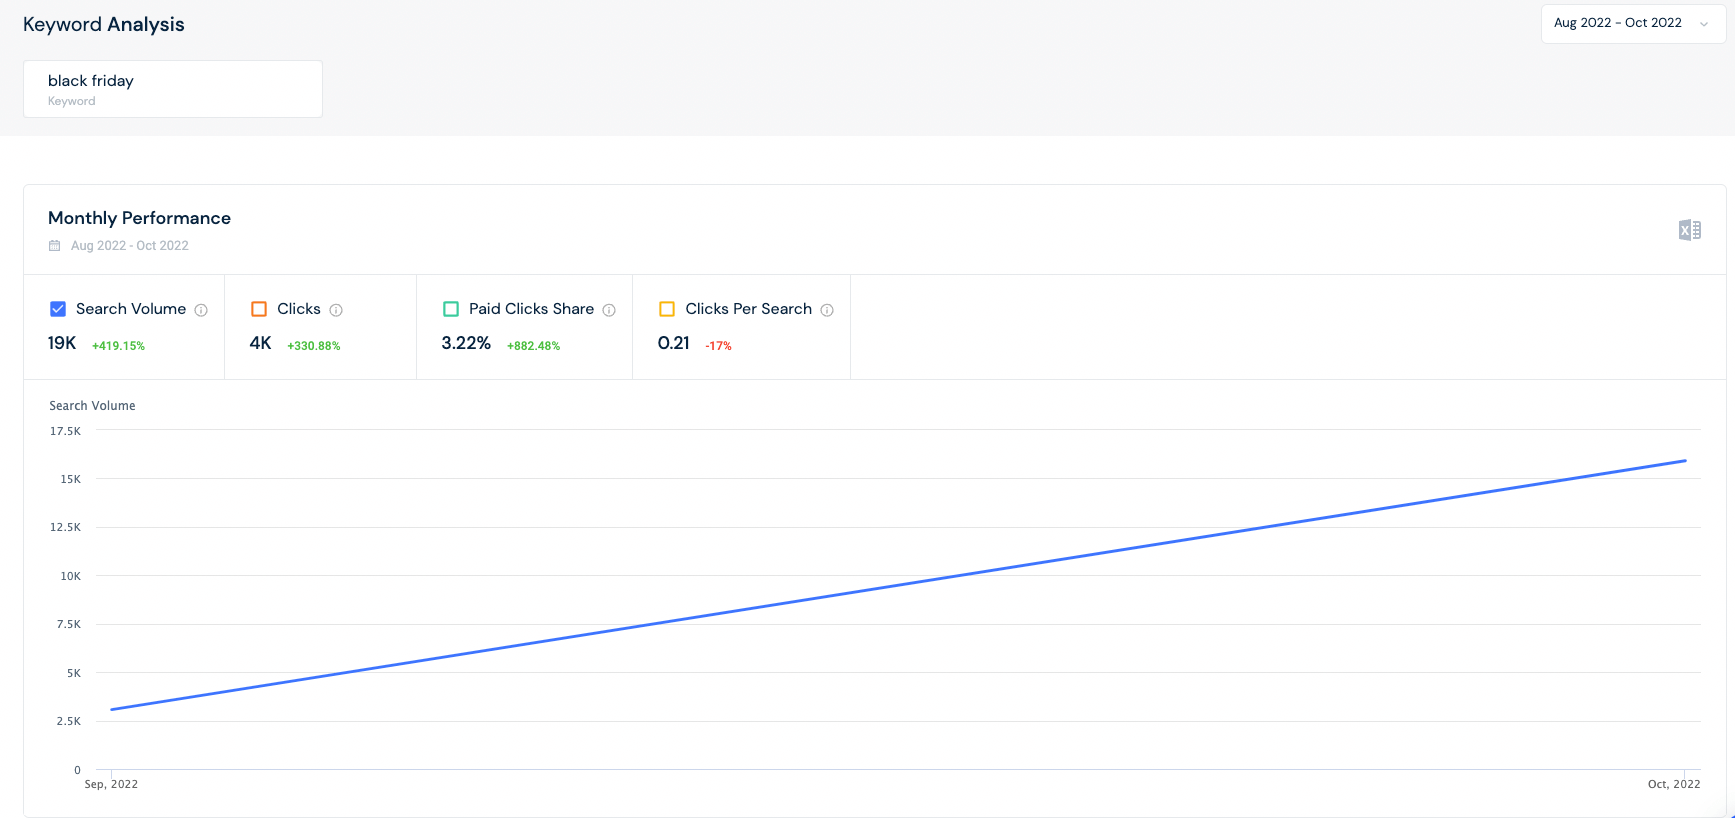
Black Friday 2022: Amazon trends and statistics

  1. Due to the cost of living increases in recent months, discounts have grown. The average discount by price points (based on Prime Day discounts) are:

  1. Similarweb Shopper Intelligence shows that year over year “Amazon Basics” products have increased revenue about 135%.
  2. Ramp up to Black Friday is looking good. In September 2021 Amazon had about 9.9 billion product views, in 2022 that number has jumped to 10.2 billion product views, an increase of of almost 3%.

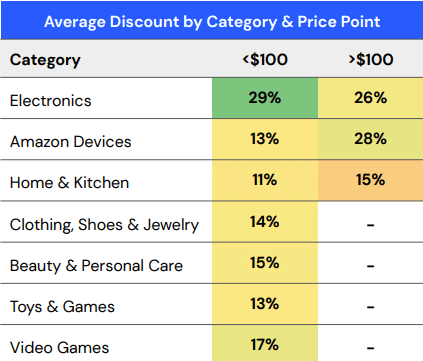
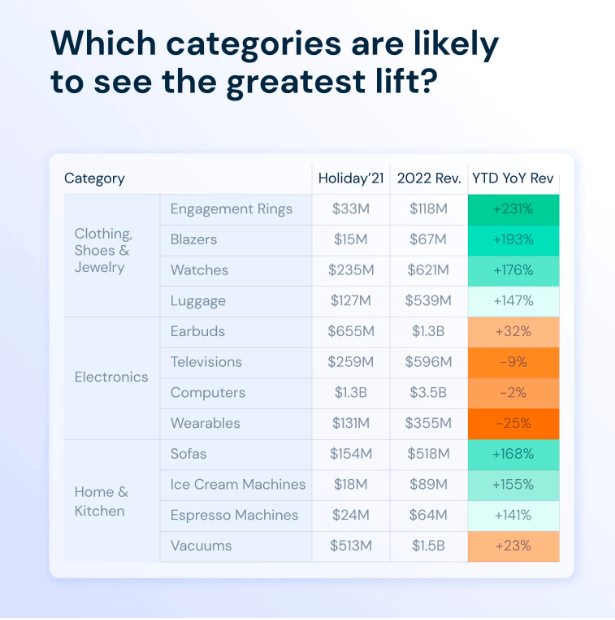
  1. Similarweb Shopper Intelligence data shows that in this year’s ramp-up period clothing, electronics and home are the three biggest categories shoppers are interested in.

  2. More than 74% of U.S. consumers start their product searches on Amazon, suggesting that Bezos’s monopoly isn’t just limited to Black Friday, as reported by emarketer.

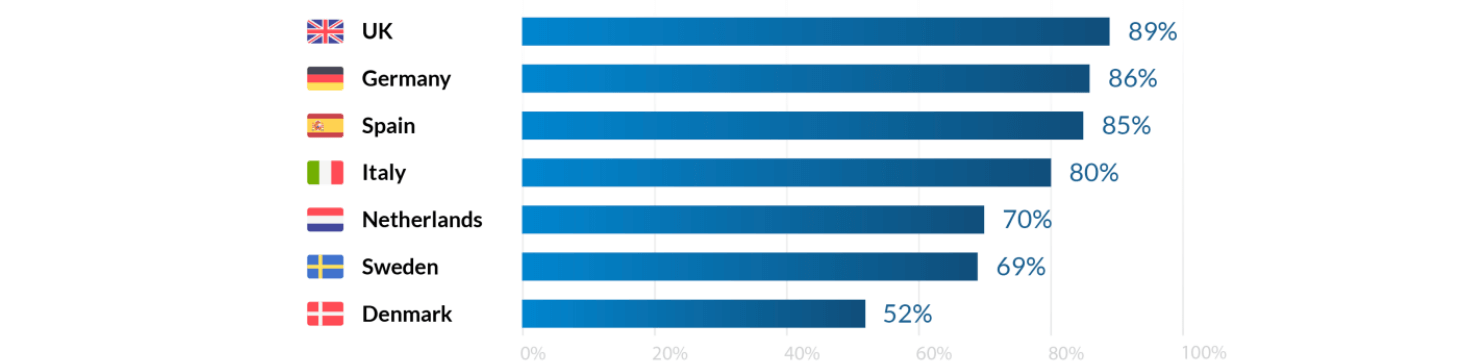
Black Friday 2022: General ecommerce and shopper trends

  1. So far in 2022, ecommerce sales account for about 21% of global retail sales, approximately a 50% increase from pre-pandemic levels, according to the Digital Dot.
  2. Social commerce accounts for about 4.5% of all online purchases in the US.
  3. Over 70% Shopify purchases were made on mobile phones, according to the popular online store powerhouse.
  4. There’s a fairly even distribution of shoppers across Gen Z, Millennials, and Baby Boomers. But, the largest group (24%) of consumers buying online are between the ages of 25 and 34 years old.

  1. Future Publishing reported that about 76% of American consumers plan to do the majority of their holiday shopping on Black Friday this year.
  2. According to Dot Digital a whopping 94% of shoppers plan to do their shopping online this year. (And expect to find better discounts online than they would in brick-and-mortar stores.)
  3. On Black Friday the cart abandonment rate is approizately 78% globally (Digital Dot).
  4. The average amount saved per shopper on Black Friday is about 24%.
  5. Search volume for the keyword “Black Friday” has increased by a whopping 419% since September 1, 2022, as people begin searching for Black Friday sales.

What is the history of Black Friday?

The term began in Philadelphia in the 1960s referencing the day between Thanksgiving (Thursday) and the annual Army-Navy football game (Saturday). The police nicknamed it “Black Friday” because officers had to work long hours while dealing with horrible traffic and crowds. Since local retailers wanted to use those crowds to increase profits businesses reclaimed the name, saying that the day was when stores’ finances went from red ink to black.

The reclaimed term stuck and spread first across America, and now thanks to the globalized economy, to worldwide retailers.

Black Friday vs. Cyber Monday

Cyber Monday takes place on Monday immediately following Black Friday. With retailers offering exclusively online discounts, it acts essentially as Black Friday’s eCommerce counterpart. It’s also fair to say it’s just about the only Monday in the year anyone looks forward to!

2020 Cyber Monday – accounted for the biggest online shopping day in U.S. history, bringing in an astounding $10.7 billion. However, in 2021, shoppers spent about $100 million less than that.

While Black Friday certainly has a richer history, Cyber Monday is becoming the more hotly-anticipated event. Here are three key stats to help you best leverage the day:

  1. According to Salescycle.com, in 2021, the peak time for mobile online Cyber Monday traffic was 21:00, while desktop traffic peaked at 11:00.
  2. Electronic products such as AirPods, HP and Dell laptops, Nintendo Switches, Samsung TVs, Chromecasts, and VR devices are consistently among Cyber Monday’s top-selling items. (Source: Adobe Digital Insights)
  3. Cyber Monday has grown in popularity in European countries as well, namely: the UK, Germany, Spain, Italy, Netherlands, Sweden and Denmark.

Make ‘em shop ‘til they drop

There’s just enough time left to tweak your Black Friday strategy. Data is power and it’s all right at your finger tips. Leverage the statistics and trends in this blog to drive as much traffic as you can for the big day.

To learn more about the data behind this article and what Similarweb has to offer, visit https://www.similarweb.com/.

GET WEEKLY ALERTS

Sign up to receive our stories in your inbox.

The email you entered is not valid.

LET US HELP

Data is changing the speed of business. Investors, Corporations, and Governments are buying new, differentiated data to gain visibility make better decisions. Don't fall behind. Let us help.

DATA PROVIDER SPOTLIGHT

Advan

Advan provides hedge funds and institutional investors with unmatched insights into both foot and vehicle traffic to enable better investment decisions. Using precise, manual geofencing, it has the most extensive and accurate location data, available in seconds through an intuitive, self-service dashboard. Its institutional-grade analytics allow fast and actionable insights into customer behavior and corporate activity.

Advan is headquartered in New York City. For more information please visit www.advan.us