
For the week of 6-12 November 2022, the post-Halloween demand return continued, as the metric increased 3.4% week on week (WoW). As a result, occupancy rose to 64.6% from 62.4% a week prior. Midweek occupancy, Tuesday through Thursday, fell slightly from 65% to 64.8% as softness outside the Top 25 markets dampened the measure. Top 25 midweek occupancy rose to 71.8%, up 0.5 percentage points (ppts) WoW. Weekend occupancy remained above 73% across the U.S., up 0.7ppts WoW. After three straight week-on-week declines, nominal average daily rate (ADR) rose 0.3% WoW to US$148, which was 13.7% higher than a year ago and 17% greater than in 2019. Inflation-adjusted (real) ADR was 1.4% better than the 2019 figure. Nominal revenue per available room (RevPAR) increased 3.9% WoW to US$96. The measure was up 19% year over year (YOY) and 2.3% from 2019.
STR’s weekly figures date back 23 years. Keeping that in mind, this was the eighth time this year when a week produced the highest room demand on record for that specific week. The 25 million room nights sold surpassed 2018, the previous week 46 record holder, by 296,000 room nights. Said another way, 42,000 more rooms were sold every day this past week than in 2018. Occupancy, however, was 1.9 percentage points (ppts) lower than in 2018, but that’s due to supply, which is 4.1% higher than in 2018. Additionally, this past week’s room demand surpassed 2019 by 756,000 room nights, while occupancy was up 0.6ppts.
The eight weekly demand records in 2022 is the second highest of any year, and nearly all of the instances have come since the start of summer. The majority of records (27 of 46 weeks) continue to be held by 2019. By market type, the Top 25 Markets have set weekly demand records only five times this year. On the other hand, all other markets have broken weekly demand records in 20 of the past 46 weeks, the most for any single year since weekly tracking began.
Fort Myers again had the nation’s highest occupancy (84%), its second consecutive week in the top spot, followed by Phoenix (83.7%) and New York City (83%). New York City has seen occupancy surpass 80% 20 times this year with half of those occurrences coming in the past 11 weeks. In all of 2020 and 2021, NYC occupancy surpassed 80% just twice as compared with 42 times in 2019.
Hurricane Nicole resulted in demand losses up and down Florida’s and Georgia’s coastline with the largest declines seen in Daytona Beach, where demand fell 38.5% WoW and occupancy only reached 39%. Demand in the submarkets of Panama City, FL and Brunswick/Kingsland, GA were also down by 15% each. Despite the hurricane’s impact, statewide demand and occupancy were up week over week in both Florida and Georgia.
Midweek occupancy in the Top 25 Markets advanced slightly to 71.8% from 71.3% a week prior. The deficit to 2019, which was 5.3ppts, was down slightly from the weeks prior to Halloween. Phoenix had the highest midweek occupancy (85.9%) followed by New York City (81.9%). Midweek occupancy in Phoenix was above the level seen in the comparable week of 2019 while New York City continued to trail that level. The strong performance in Phoenix came from increased group demand, which accounted for 55% of the week-on-week gain in total room demand. Boston and Anaheim (Orange County) also reported strong growth in midweek occupancy with both also benefiting from increased group, but to a lesser extent than Phoenix. Denver saw the largest week-on-week decrease in occupancy, from 75.6% to 67.4%. The largest driver of Denver’s lessened performance was lower group demand, which accounted for 70% of the total loss in room nights.
For only the eighth time this year, group demand among luxury and upper upscale hotels surpassed two million room nights—most of those occurrences coming since the end of summer. In 2019, group demand exceeded two million room nights in 19 weeks. The group deficit to 2019 is most evident in the spring and summer months of this year as this year’s fall has as many weeks with group above two million as in 2019.
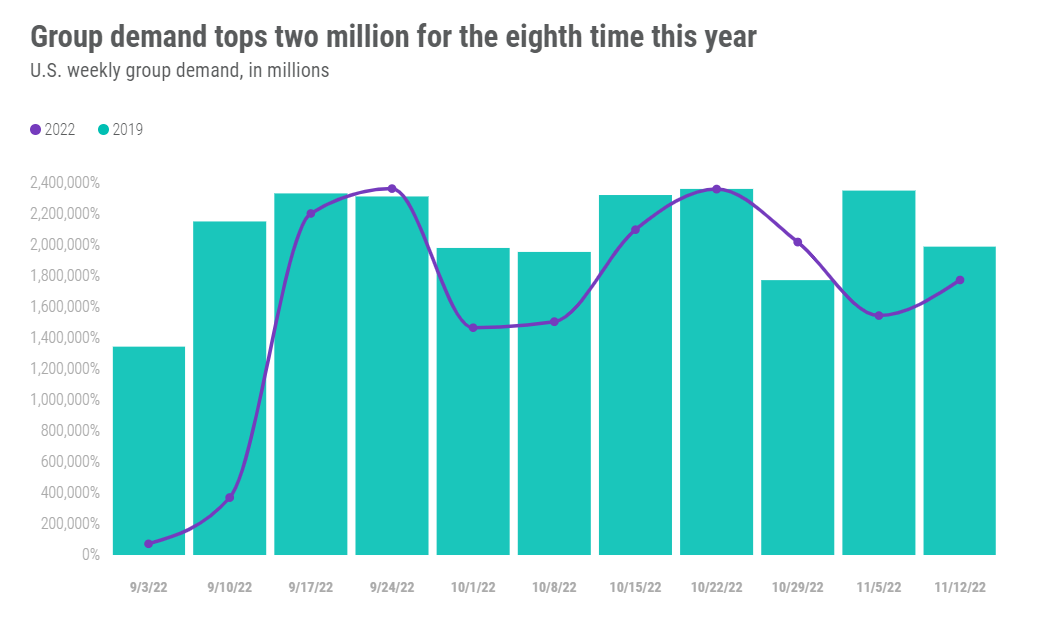
With increased group demand, it wasn’t surprising that Luxury and Upper Upscale chain scales saw the largest week-on-week gain in occupancy with weekly occupancy above 70% and the midweek level above 72%. Upscale hotels also did well and had similar occupancy levels in both time periods.
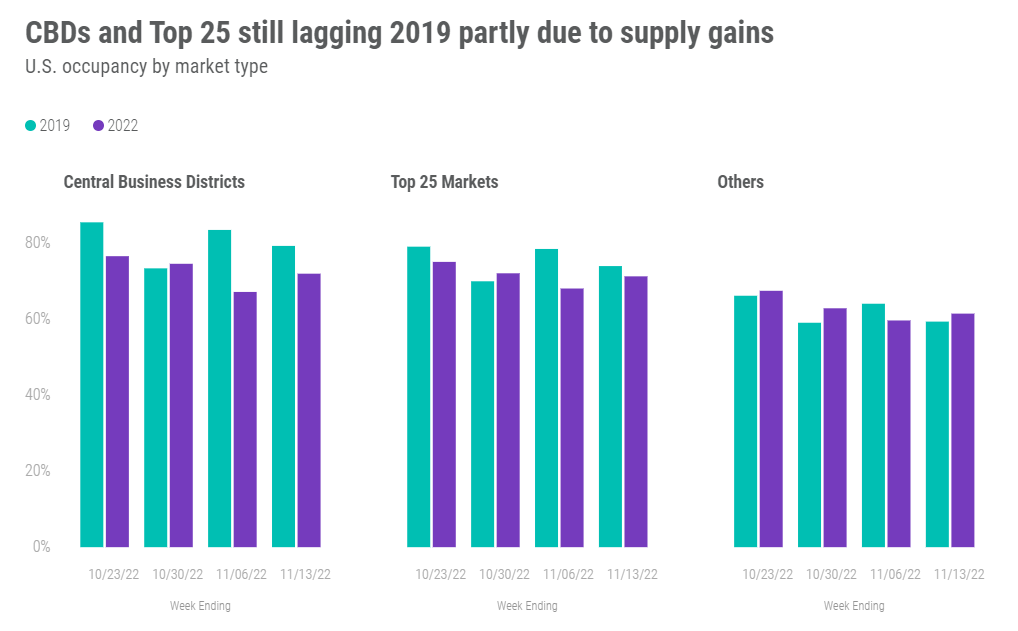
Central business districts (CBDs) saw solid performance with weekly occupancy reaching 71.8% and midweek rising to 73.7%. While good, the gap to 2019 remained significant at 10.1ppts, due in part to supply growth, which has been substantial (+7.3%). Even if supply had been static though, there was still a gap to 2019 occupancy (-4.8ppts). Austin CBD had the highest midweek occupancy at 89.7% with the Boston CBD (89.3%) closely behind. Both markets were also behind their 2019 performance, but both sold more rooms this week than in 2019.
Week-on-week nominal ADR growth surprised on the downside as we expected a slightly higher level based on historical trends. Most of the week-on-week growth came from Sunday and Monday when ADR was up by more than 6.4% due to easy comparisons to Halloween in the prior week. ADR from Tuesday to Thursday was down 2.1% WoW with the weekend rising 0.6%. For the full week, real ADR was up 1.4% versus the comparable week of 2019, however, that realization came entirely from the weekend when real ADR was 14% higher than what it was three years ago. The remaining days of the week saw real ADR below 2019 by 4% with the lowest points on Tuesday (-7%) and Wednesday (-6%). Despite the strong weekend showing again 2019, year-on-year ADR growth over the weekend continued to be less (+10.3%) than on the remaining days (+16.3%), a trend that has been observed since early in the year. Recall, weekend ADR recovered quickly after the end of lockdowns, hence growth is slower this year.
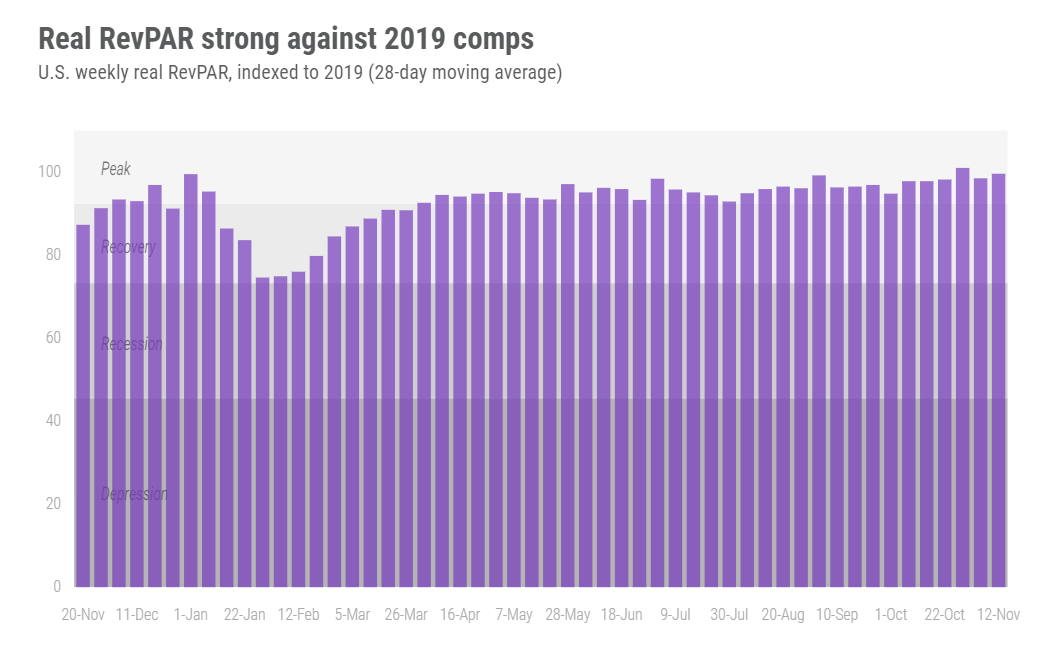
Over the past 28 days, most U.S. markets (103 of 166) showed real RevPAR above 2019 with the total industry right at the 2019 level. The Florida markets (Sarasota and Fort Myers) hit hardest by Hurricane Ian continued to post the highest real RevPAR above 2019 (50%+). Among the Top 25 Markets, Tampa had real RevPAR 23% greater than its 2019 level followed by San Diego and Phoenix, where real RevPAR was at least 11% higher than in the same four weeks of 2019. Oakland, San Francisco, San Jose and Portland, OR continued to be in our “recession” category as real RevPAR was less than 80% of what it was in 2019.
Around the Globe
Outside of the U.S., occupancy increased 3.6ppts WoW to 63.9%. The week-on-week gain was the largest of the past 37 weeks with 70% of all countries reporting A gain. Nominal ADR was flat (0.0% WoW) with the measure at US$134. RevPAR rose 6% WoW to US$85. Both real ADR and RevPAR were above their 2019 levels.

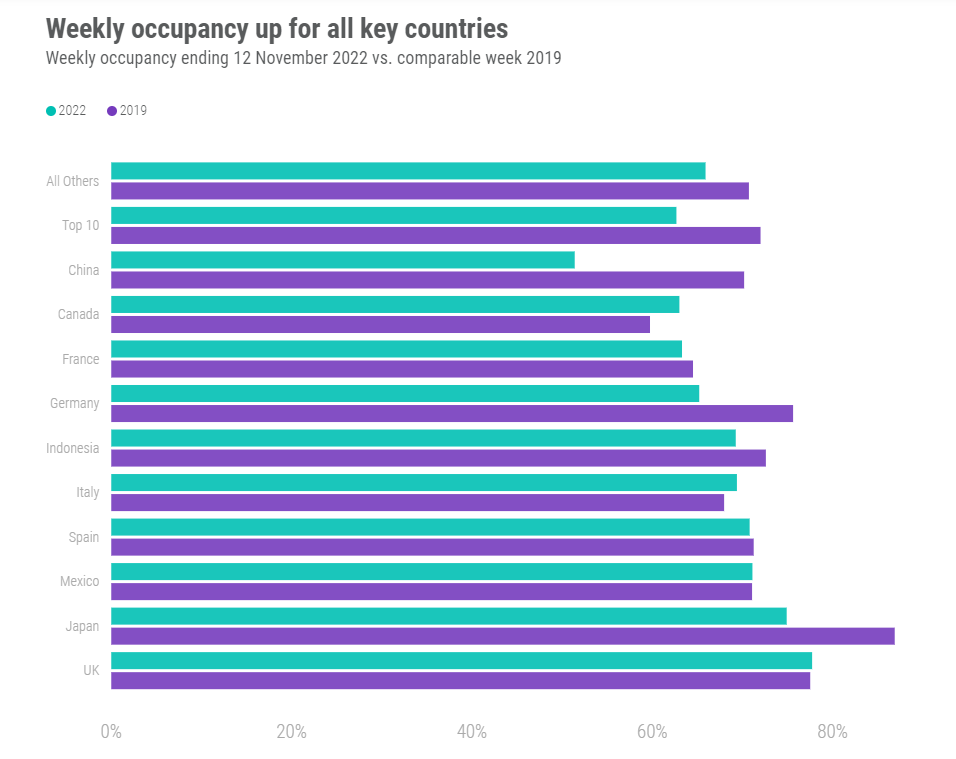
The week’s highest occupancy was seen in Barbados (87%) with four other countries, including the United Arab Emirates and Singapore, above 80%. Among the 10 largest countries based on hotel supply, the United Kingdom had the highest occupancy (77.7%) followed by Japan (74.9%) and Mexico (71.1%). Every one of the top 10 reported week-on-week occupancy growth. Occupancy in China surpassed 50% for the first time in six weeks.
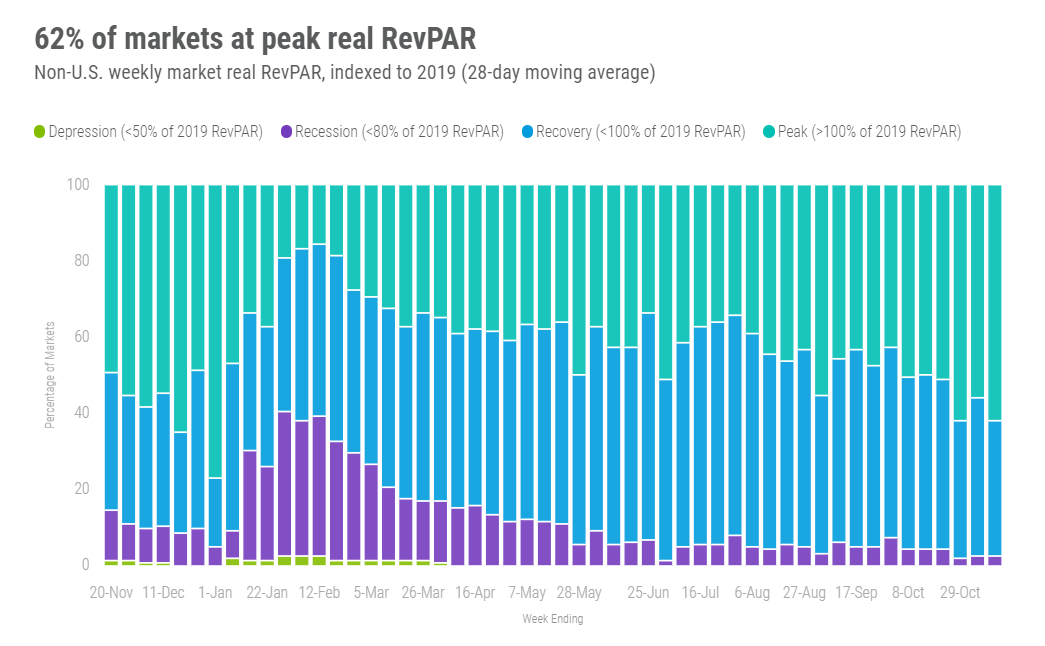
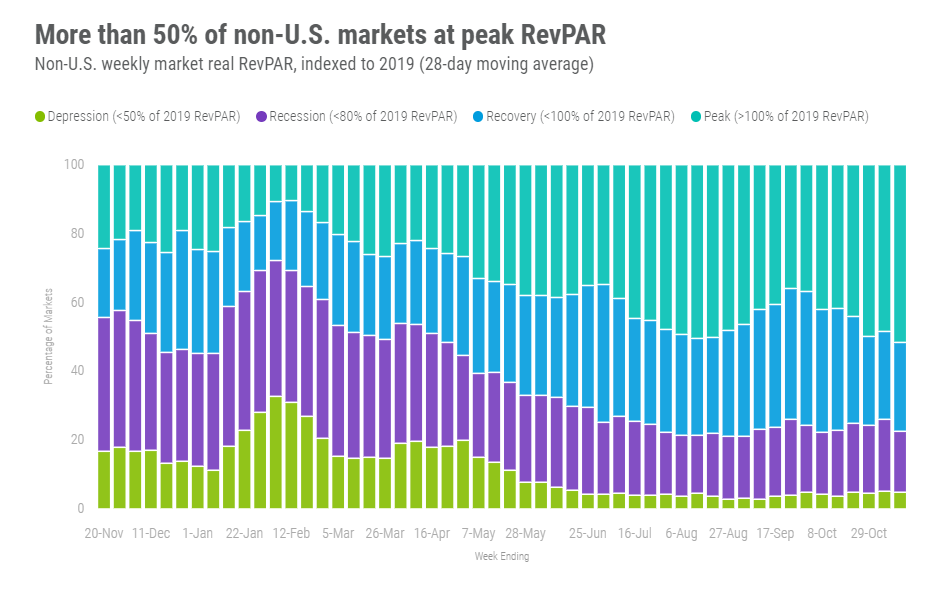
The number of non-U.S. markets with Real RevPAR above 2019 over the past 28 days reached a pandemic-era high of 52% or 178 of 344 STR-defined markets. Five percent (16 markets) remained in “depression” as real RevPAR was less than 50% of what it was in 2019.
Big Picture
This week’s industry performance was generally in line with our expectations, although U.S. demand growth was on the lower side of our predictions. We anticipate U.S. industry demand to slip in the next week (week ending 19 November 2022) due mainly to weaker weekend performance ahead of the Thanksgiving holiday. A further drop in demand will occur during the Thanksgiving week with growth returning up until the Christmas holidays.
To learn more about the data behind this article and what STR has to offer, visit https://str.com/.


Sign up to receive our stories in your inbox.
Data is changing the speed of business. Investors, Corporations, and Governments are buying new, differentiated data to gain visibility make better decisions. Don't fall behind. Let us help.


Sign up to receive our stories in your inbox.
Data is changing the speed of business. Investors, Corporations, and Governments are buying new, differentiated data to gain visibility make better decisions. Don't fall behind. Let us help.