
Somehow, another year is gone. 2022 was a somewhat challenging period for the multifamily industry, especially relative to an historic 2021. With 2023 now ahead, some of the defining features of last year persist, and others have begun to fade. These changes, as well as new dynamics that will emerge this year, have the industry on a path to another fascinating year on the heels of three years that will be discussed well into the future.
With an eye to the future, the focus of this month’s newsletter will be to identify some of the issues worth watching as the new year unfolds.
Inflation
One of the central issues of last year was inflation and, unfortunately, this is an issue that has persisted into the new year. The inflation issue began in the second quarter of 2021 and both inflation itself and its impact on the economy only grew as 2021 turned to 2022.
According to Bureau of Labor Statistics data, growth in both the overall Consumer Price Index and the core Consumer Price Index, which removes energy and housing costs, peaked on a year-over-year basis in the summer of last year. Even so, declines in inflation growth are not the same as declines in the inflation rate itself, and significant improvement remains necessary to bring inflation back to a historically normal level. With food and energy constituting the major components of inflation at this point, it is an issue that continues to affect consumers in their regular and less elastic consumption.
For the sake of space, only the consumer side of inflation will be covered here but it is important to keep in mind the impact inflation has on the production side of the economy as well. For multifamily this is especially impactful with new supply, but rising wages, materials costs, and supplier prices all have an effect on operations.
Financial Position of Consumers
The rising costs of the last eighteen or so months across the economy paired with the lack of stimulus payments and other pandemic response policies that were present in 2020 and 2021 have somewhat eroded the financial position of U.S. households in the time since. This was felt probably most particularly for multifamily in the substantially lower apartment demand of 2022. This erosion is another issue that will be present in 2023 – and will potentially be worse.
A couple of measures are useful here. One is Disposable Personal Income (DPI) from the U.S. Bureau of Economic Analysis. This data set provides a monthly picture of disposable (after-tax) income for the country. Going back to 2017, the three highest values for this measure were in April 2020, January 2021, and March 2021 – the three months in which federal stimulus payments were dispersed as a response to the COVID-19 pandemic and associated disruptions.
During the back half of 2021, DPI fell consistently before rising through all of 2022 on a trajectory that resembled that of the 2017 – 2019 period when the U.S. was enjoying one of the strongest economic periods in decades. However, when accounting for inflation the picture was not as rosy. Data for December 2022 has not yet been released at the time of this writing, but the 4.6% increase in disposable income through November of last year fell to a 0.1% gain after adjusting for inflation.
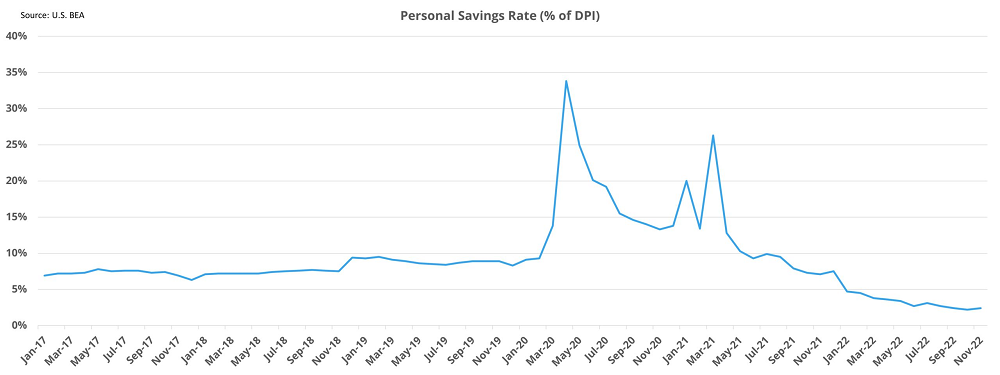
Another useful measure for getting a picture of the financial position of consumers is the Personal Savings Rate data set from the U.S. Bureau of Economic Analysis. This measure represents the share of personal income not allotted to spending or to taxes.
Unsurprisingly, the three highest data points for the personal savings rate going back to 2017 were also the three months in 2020 and 2021 that included federal stimulus payments. Since the most recent peak of 26.3% in March of 2021, a steady downward slope brought the savings rate to just 2.4% in November of 2022. For context, the average savings rate from 2017 through 2019 was 7.9%.
Unemployment
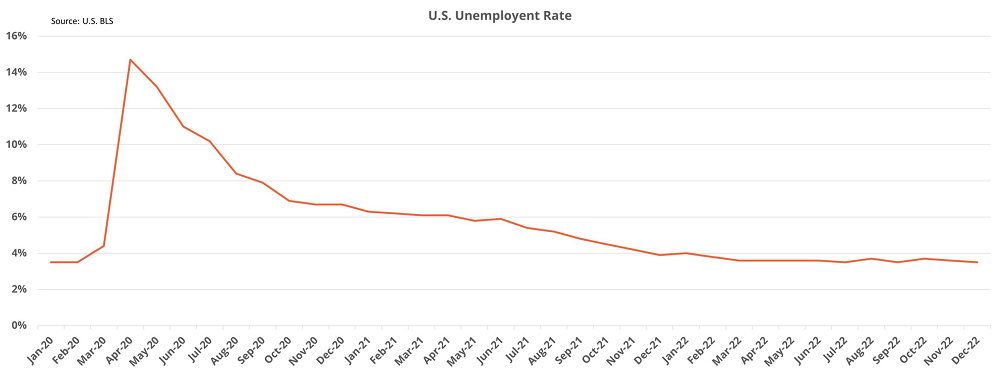
Rising interest rates due to the attempts of the Federal Reserve to curtail inflation not only have an effect on domestic consumption and business activity as capital becomes more expensive. The intentional cooling of the economy also invariably comes with heightened unemployment. The very tight labor market of the last two years has been a major reason why the economy managed to stay on relatively firm ground through the worst inflationary period in decades. However, it also contributed to inflation through wage inflation and by fueling consumer demand at a time when supply was inconsistent for many goods and even services.
However, in recent months there have been indications below the national data that the tide has seemingly begun to turn. There have already been substantial layoffs either announced or enacted, particularly in the tech and financial sectors. Amazon, Google, Meta, Salesforce, Twitter, Goldman Sachs, JP Morgan Chase, and Morgan Stanley are just some of the major names to announce layoffs in recent months. Additionally, even as the cost of materials has started to abate, the manufacturing sector has been slowing as well in the face of lower demand.
As unemployment rises, other sectors such as retail, hospitality, and tourism can be impacted as consumer confidence and consumer spending dry up. For this reason, even a moderate shift in the unemployment picture is likely to impact all multifamily markets to some degree –regardless of the make-up of the employment base.
Should unemployment become a major component of the 2023 environment, which is likely at some point, it will be as a result of attempts to rein in inflation. It will also come at a time when households are less able to absorb the change thanks in part to the issues addressed in the previous section.
Domestic Net Migration
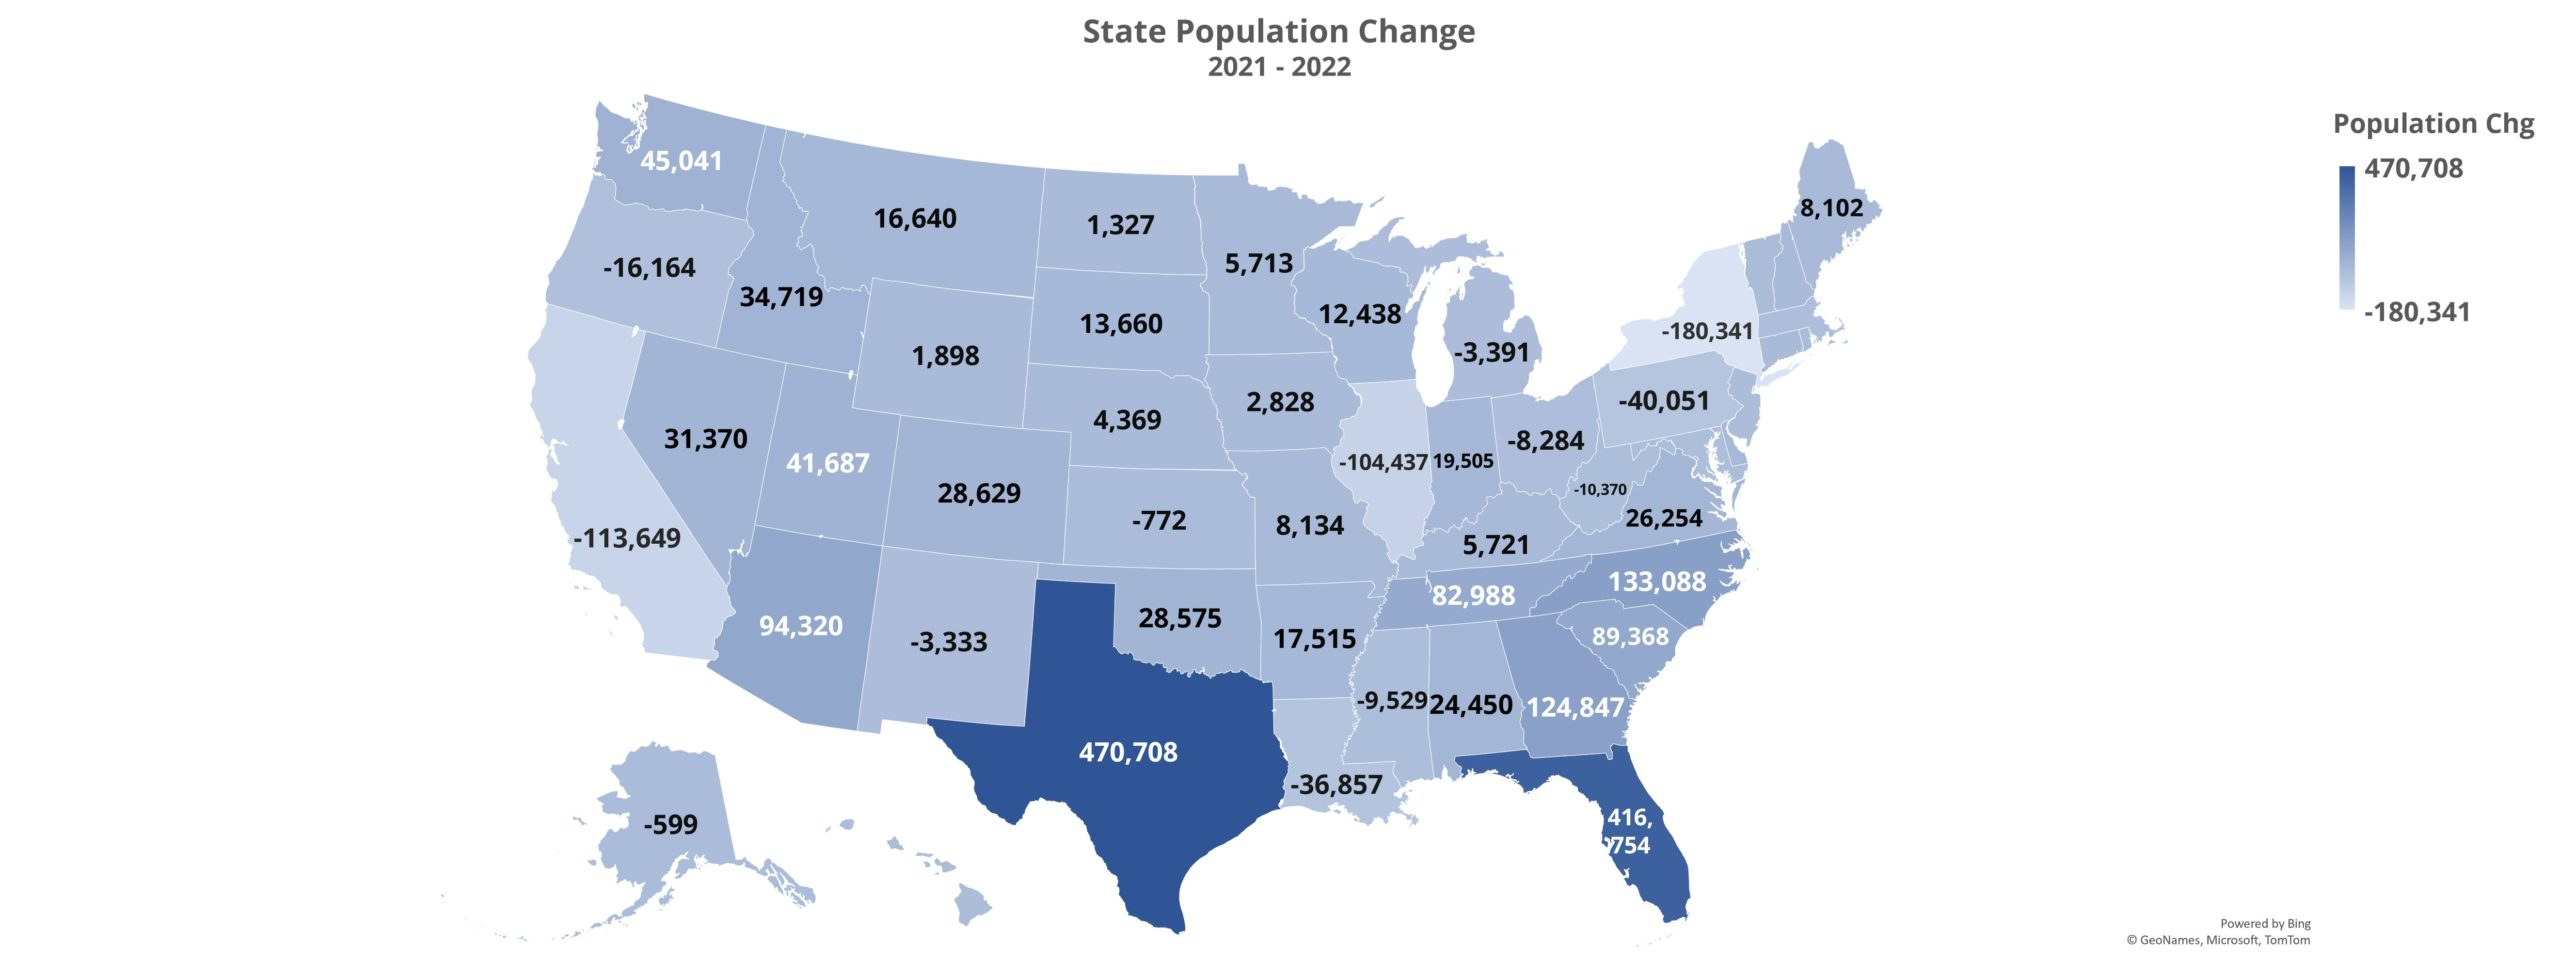
The state-level population data for 2022 released recently by the U.S. Census Bureau reflected the general continuation of migration trends that have been in place over the last decade and that were accentuated during the pandemic era. Namely, states like California, Illinois, New York, and Pennsylvania have led the nation in domestic net out-migration and the Southeast, Mountain West, and Texas have led the way in net in-migration.
With population growth having slowed considerably in recent years, domestic net migration has become even more important to watch. Gateway markets such as Chicago, New York, Los Angeles, and San Francisco have a greater ability to handle some net out-migration thanks to the very large and dense populations of those markets. The impact of net out-migration in areas like Louisiana, Mississippi and West Virginia is another matter and presents more of a challenge for operators there.
There does exist some risk for the recent high-growth areas as well. Markets such as Boise, Phoenix, Las Vegas, Austin, Nashville, Charlotte, Miami, Orlando, and Tampa among others that have enjoyed persistent strong population in recent years now have the multifamily construction pipelines to match.
A material slowdown in net in-migration would act as a headwind to average occupancy with new supply not getting absorbed at the same rate. This would not only be the case because of lower population growth, but also because some of these markets have been at the tip of the spear for rent growth in the last two years. Those gains have tended to make affordability more of an issue for existing residents than for the incoming population.
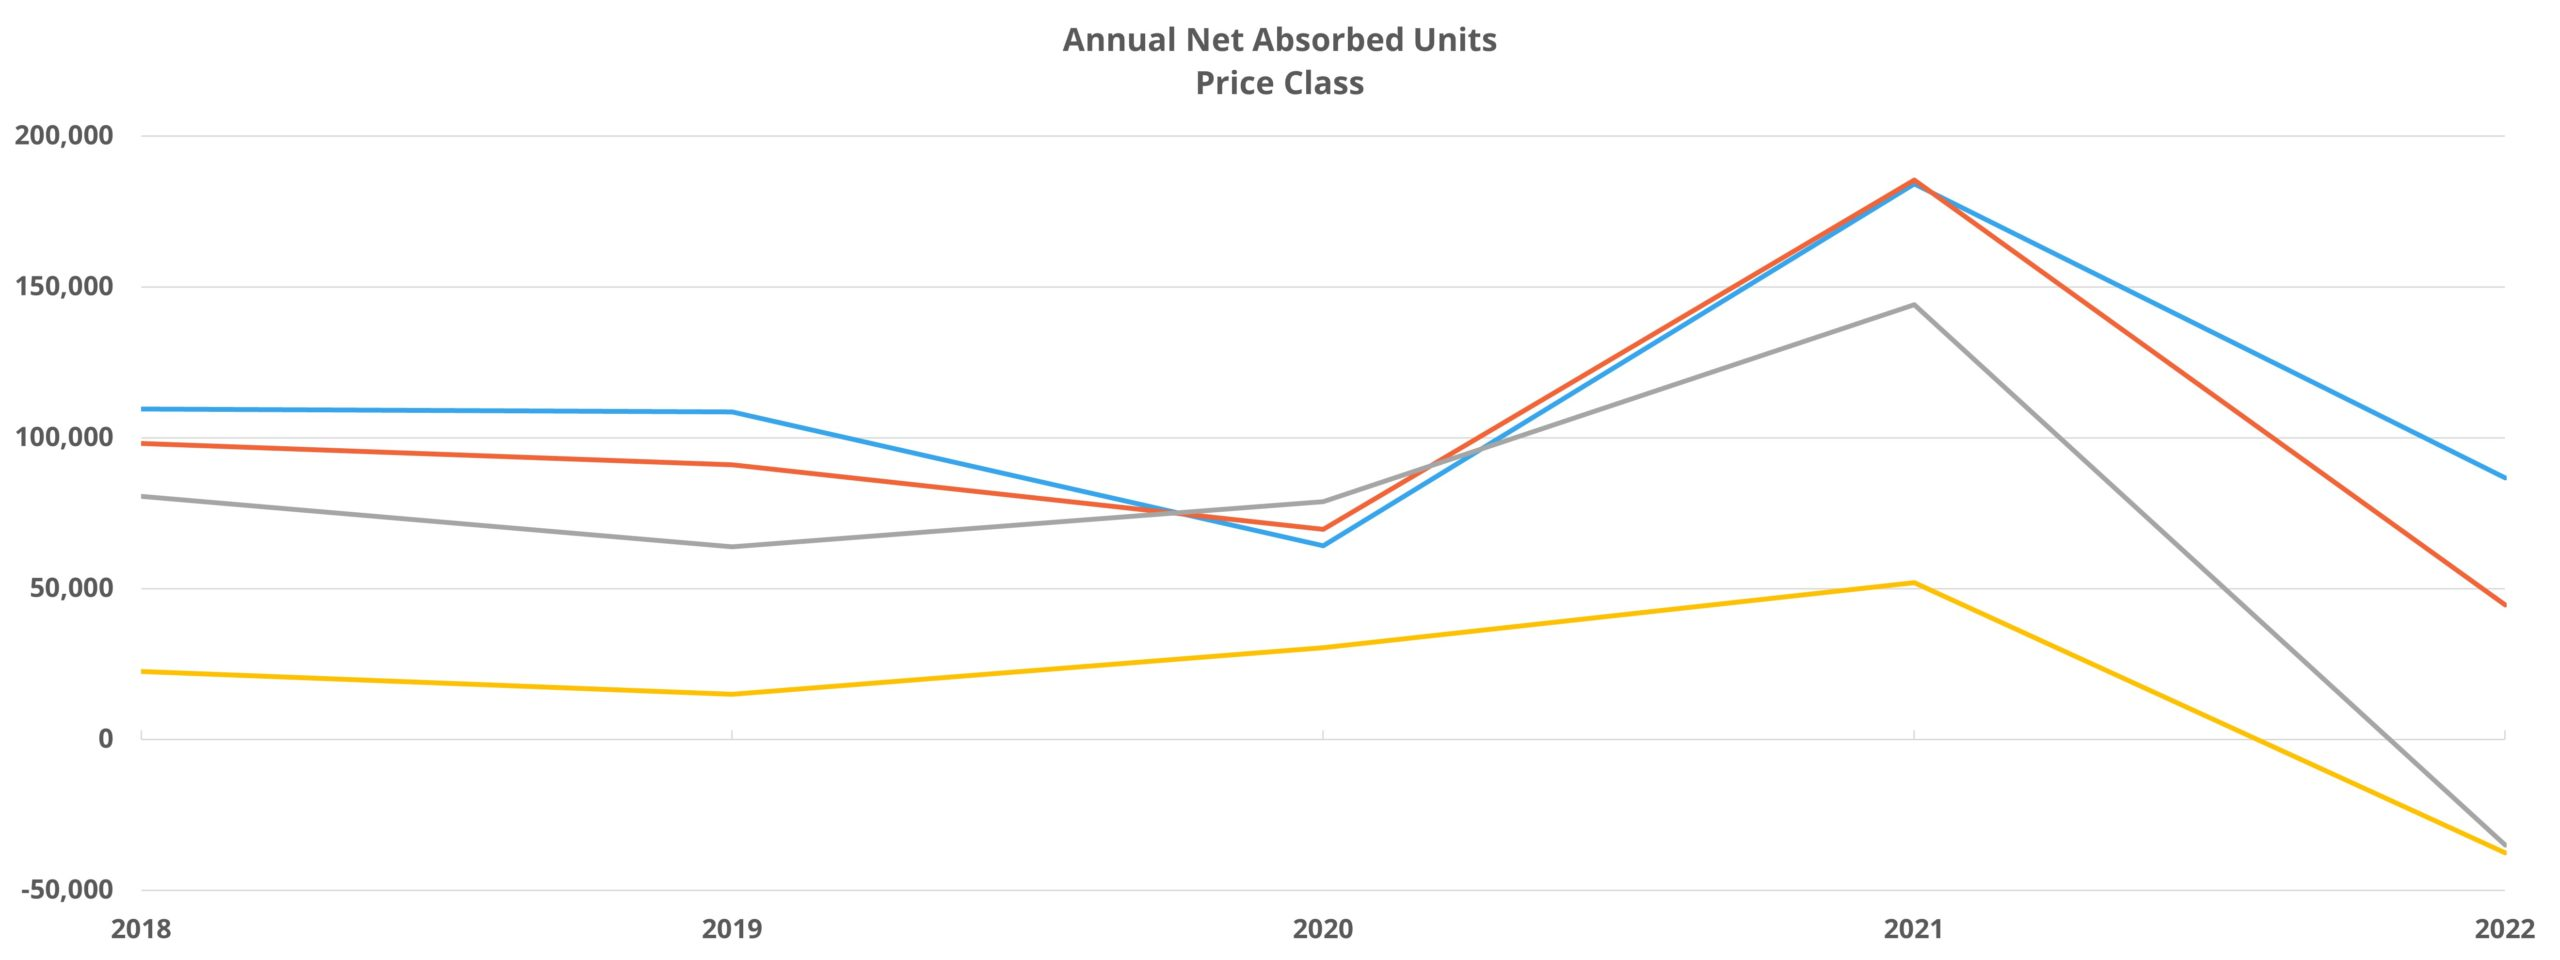
Price Class Differences
There was a stark difference in how 2022 played out across the price classes for the multifamily industry. Class A demand, while substantially lower than in 2021, was the most resilient of the four tiers. Only Class A net absorption managed to surpass its 2020 total and annual net absorption for both Class C and Class D was negative in 2022 in the face of double-digit rent growth.
Class A properties have been better positioned to weather the volatility of the last few years partially due to the profile of a typical resident. Jobs that could be more easily transitioned to remote or hybrid work models and higher incomes were part of the story. So too was reduced competition from single-family purchases as constrained supply and skyrocketing prices were subsequently met with rising interest rates.
The single-family environment may not dramatically improve in 2023. Low existing supply will likely be exacerbated in the near term by a slowdown in construction starts on the part of skittish builders and by hesitancy of would-be sellers to enter what is becoming a buyer’s market in many areas. Similarly, single-family prices may decline in 2023 but elevated interest rates could mitigate the decline’s impact on affordability for prospective buyers. These factors should provide some level of demand for multifamily. The effect would be concentrated in the top price tiers but will also vary according to the own-to-rent ratio of particular markets.
On the other side of the coin for Class A properties, the layoffs that have already made headlines have tended to be corporate positions in large tech and finance companies located in gateway markets. Layoffs of high-wage corporate positions in expensive markets with lower rates of home ownership mean that the impact of a softening job market could be felt early on for the Class A space – and more profoundly than was seen in the chaos of 2020.
New Supply
About 400,000 new units were delivered across the country in 2022. This continued the upward trend in annual deliveries that had been in place since the middle of last decade. With more than one million units in the construction pipeline that have broken ground but are not yet leasing, multifamily new supply will not be declining in 2023.
Look for new supply pressure to affect two already-discussed subsets in particular – Class A properties and high-growth markets. Class A properties will have to deal with increased competition from new properties which usually enter the market in the Class A segment. Especially if demand remains tepid, Class A operators could find themselves increasingly pulling the lease concession lever to offset declining occupancies associated with the heightened competition.
High-growth markets could also feel the pinch of increased deliveries as already briefly mentioned. Many of these markets have calibrated a construction pipeline according to the demand from the 2019 through 2021 period just given the life cycle of new multifamily development. Of course, forecasting is done for future demand when these properties are expected to enter the market, but it would be hard to find a published forecast for 2022 apartment demand that was close to the paltry 49,000-unit total it ended up being.
With subdued apartment demand, a reasonable expectation for 2023, there could be some short-term challenges to occupancy in markets that will be seeing significant deliveries. Fundamentals in the growth markets across the Sunbelt and Mountain West remain positive from the perspective of migration, relative cost of living, and a bigger picture housing undersupply. As a result, any rockiness in these markets associated with absorbing new supply will hopefully be temporary speed bumps.
Takeaways
The items discussed above are certainly not an exhaustive list but do at least provide some framework for thinking about the year ahead for multifamily.
On the one hand, it is possible that the Federal Reserve will manage a “soft landing” with inflation coming down toward the normal range before the economy is weakened enough to precipitate a significant increase in unemployment. With supply chain issues easing and the wind already out of apartment rent growth, both major components of the current inflationary period, this outcome is possible but not necessarily probable.
On the other hand, if inflation remains a major story for a large portion of 2023 and layoffs spread throughout the economy, 2023 will be positioned for another challenging year. While of course not guaranteed, this outcome appears more likely at the moment than a “soft landing” and a dramatic turnaround in apartment demand.
Were the second scenario closer to the actual outcome than the first, higher lease concession availability, national annual average effective rent growth below 3%, and national average occupancy challenging the 90% threshold would be anticipated.
To learn more about the data behind this article and what ALN Apartment Data has to offer, visit https://alndata.com.


Sign up to receive our stories in your inbox.
Data is changing the speed of business. Investors, Corporations, and Governments are buying new, differentiated data to gain visibility make better decisions. Don't fall behind. Let us help.


Sign up to receive our stories in your inbox.
Data is changing the speed of business. Investors, Corporations, and Governments are buying new, differentiated data to gain visibility make better decisions. Don't fall behind. Let us help.