Overview
Welcome to the February 2023 Apartment List National Rent Report. Our national rent index fell by 0.3 percent over the course of January, marking the fifth straight month-over-month decline. This month’s price dip was notably more moderate than the record-setting declines we saw from October through December. That said, January’s decline was still sharper than the usual seasonal trend, signaling the continuation of a broader cooldown in market conditions.
Year-over-year rent growth is continuing to decelerate, and now stands at 3.3 percent, its lowest level since April 2021. Year-over-year growth is now pacing just slightly ahead of the average rate from 2018 to 2019 (2.8 percent), and is likely to decline further in the months ahead.
The cooldown in rent growth is being mirrored by continued easing on the supply side of the market. Our vacancy index now stands at 6.1 percent, surpassing 6 percent for the first time since spring of 2021. With a record number of multi-family apartment units currently under construction, we expect that supply constraints will continue to soften. 2023 could be the first time in years that we see property owners competing for renters, rather than the other way around.
The recent slowdown has been geographically widespread. Rents decreased in January in 67 of the nation’s 100 largest cities. Newark, NJ saw the nation’s sharpest decline, with prices down by 2.3 percent month-over-month. San Francisco, New York City, Seattle, and Washington, D.C. all experienced monthly declines of more than double the national rate. Over the past six months as a whole, no large metro area in the country has experienced positive rent growth.
Rents nationally fall by 0.3% month-over-month; prices still up 3.3% year-over-year
The national median rent increased by a record-setting 17.6 percent over the course of 2021. This rapid growth in rent prices has been a key contributor to overall inflation, which remains top-of-mind for policymakers and everyday Americans alike. While our index has shown that rent growth has been consistently cooling since early last year, the housing component of the official inflation estimates produced by the Bureau of Labor Statistics (the Consumer Price Index, or CPI) continues to rise.1 This is because movements in market rents lead movements in average rents paid, meaning that our index can signal what is likely ahead for the housing component of CPI. Thankfully for the country’s renters, our national rent index has shown that rent prices nationally have actually been falling for five straight months.
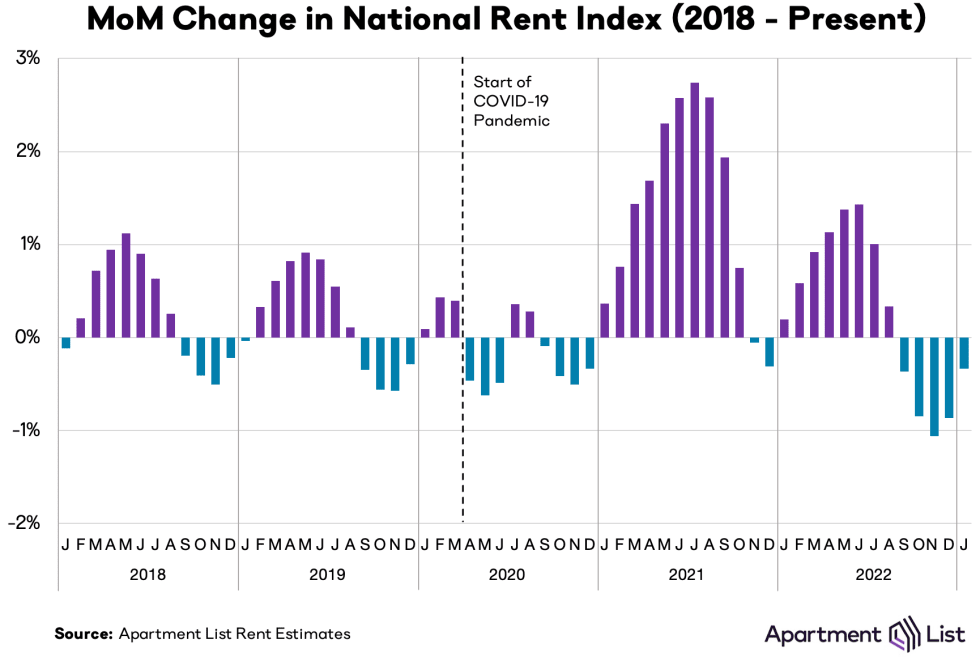
We estimate that the national median rent fell by 0.3 percent month-over-month in January. This is the fifth consecutive monthly decline, albeit a much more modest one than the three prior months, which rank as the three largest month-over-month declines in the history of our estimates (starting in January 2017). That said, this month’s decline was still notably sharper than the average January decline of 0.1 percent in the pre-pandemic years of 2018 and 2019.
Rent declines at this time of the year are typical, as rental activity tends to slow down in the fall and winter months. However, this year’s dip has been significantly sharper than what we typically see. Prices have now fallen by a total of 3.4 percent since last August. For comparison, from August 2021 through January of 2022, prices increased by 2.5 percent, as the market continued on an unprecedented stretch of record-setting rent growth which disrupted seasonal trends. And even under the more normal market conditions of 2018 and 2019, prices fell by an average of just 1.5 percent over these months, less than half of this season’s decline.
The recent dip suggests that we have entered a new phase of the rental market rollercoaster, with changing economic conditions now relaxing rental demand just as supply constraints are easing. That said, the fact that these rent declines are already moderating suggests that we shouldn’t expect rents to continue falling indefinitely. The current seasonal downtown may last a bit longer than usual, but it’s likely that we’ll see a return to positive rent growth once moving activity picks back up in the spring and summer months.
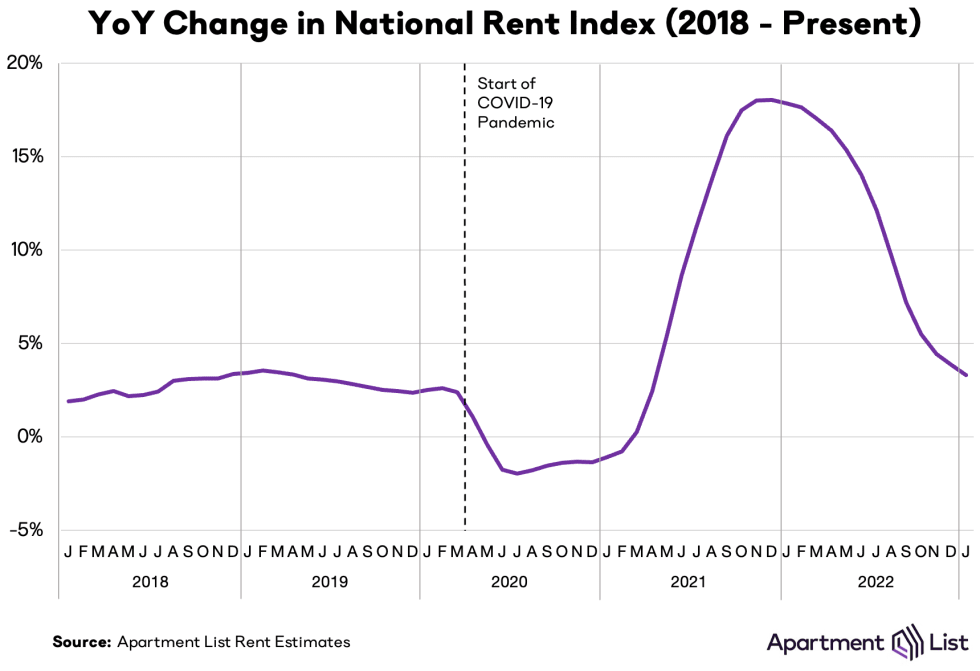
Over the course of the past 12 months as a whole, rent prices are still up by 3.3 percent. Year-over-year rent growth has now been decelerating consistently for over a year, after peaking at an astronomical rate of 18 percent in December 2021. This month marks the lowest year-over-year growth rate that we’ve seen since April 2021 and represents a return to a level of rent growth that was the norm in the years leading up to the pandemic. From 2018 to 2019, year-over-year rent growth averaged 2.8 percent, just slightly lower than the current level. And it’s likely that the year-over-year growth rate will continue to fall in the coming months, as we expect rent growth in early 2023 to be slower than it was in early 2022.
Vacancy index cracks 6% for first time since spring 2021
As we’ve explored in detail, much of the 2021 rent boom was attributable to a tight market in which more households were competing for fewer vacant units. Our vacancy index spiked above 7 percent in the early months of the pandemic in 2020, as many Americans consolidated households and moved in with family amid the uncertainty and economic disruption of the pandemic’s onset. After that, however, rapid household formation drove a sharp tightening of the vacancy rate, which eventually fell to a low of 4.1 percent in fall 2021.

But after bottoming out at 4.1 percent in October 2021, our national vacancy index has been gradually easing for over a year, and a recent acceleration of this trend has played a key role in the rent declines described earlier. In the five months from March through August 2022, our vacancy index increased by a total of 0.4 percentage points. But in the most recent five months, it has increased by a full percentage point, from 5.1 percent last August to 6.1 percent this month. This month’s reading represents the first time that our vacancy index has surpassed the 6 percent threshold since April 2021. The vacancy rate is now just barely below the pre-pandemic norm.
After a prolonged period of skyrocketing rent growth, and with non-housing related costs also getting more expensive as a result of broad-based inflation, it seems that some Americans are moving back in with family or roommates, or delaying striking out on their own. At the same time, new apartment construction is picking up steam again after facing pandemic-related delays in recent years. In fact, there are currently more multifamily units under construction than at any point since 1970. This combination of slowing household formation and rising inventory is driving the recent shifts that we are seeing in both our rent growth and vacancy indexes.
Vacancy trends are highly localized, and they have been a key indicator of rapidly evolving conditions in local markets across the U.S. throughout the pandemic. To explore the topic in greater detail, monthly vacancy data are now available for download for hundreds of cities, metros, and states, and can be easily linked to our existing rent estimates using Federal Information Processing System (FIPS) codes.
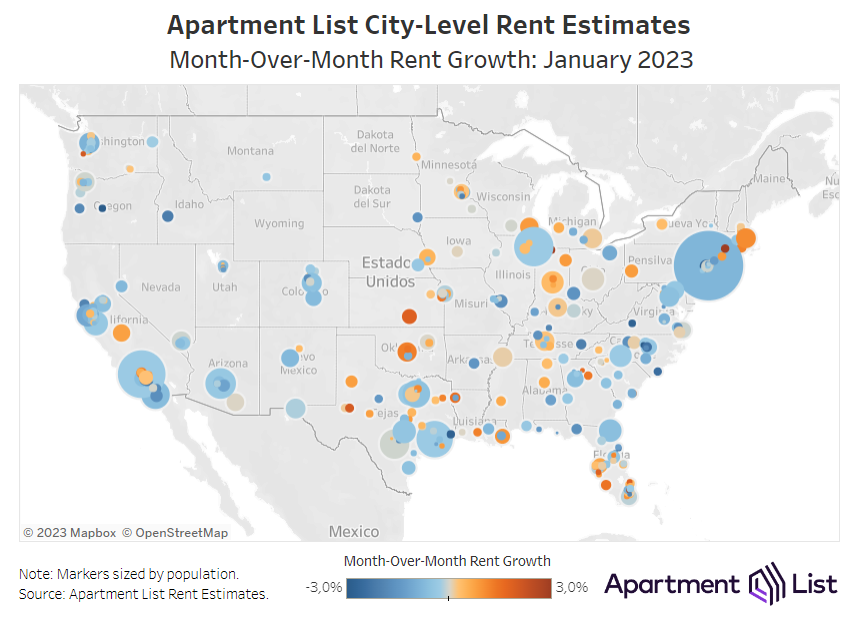
Rents fall month-over-month in 67 of 100 largest cities
The chart below visualizes monthly rent changes in each of the nation’s 100 largest cities from January 2019 to present. The color in each cell represents the extent to which prices went up (red) or down (blue) in a given city in a given month. In 2020, we can see that rents fell sharply in many of the nation’s largest and most expensive cities, while smaller and more affordable ones picked up steam, leading to some convergence in prices. Meanwhile, the dark red band in 2021 the rent heatwave which peaked in July and August 2021 when all 100 cities in this chart saw prices go up. The rightmost columns show that the recent cooldown has also been geographically widespread.
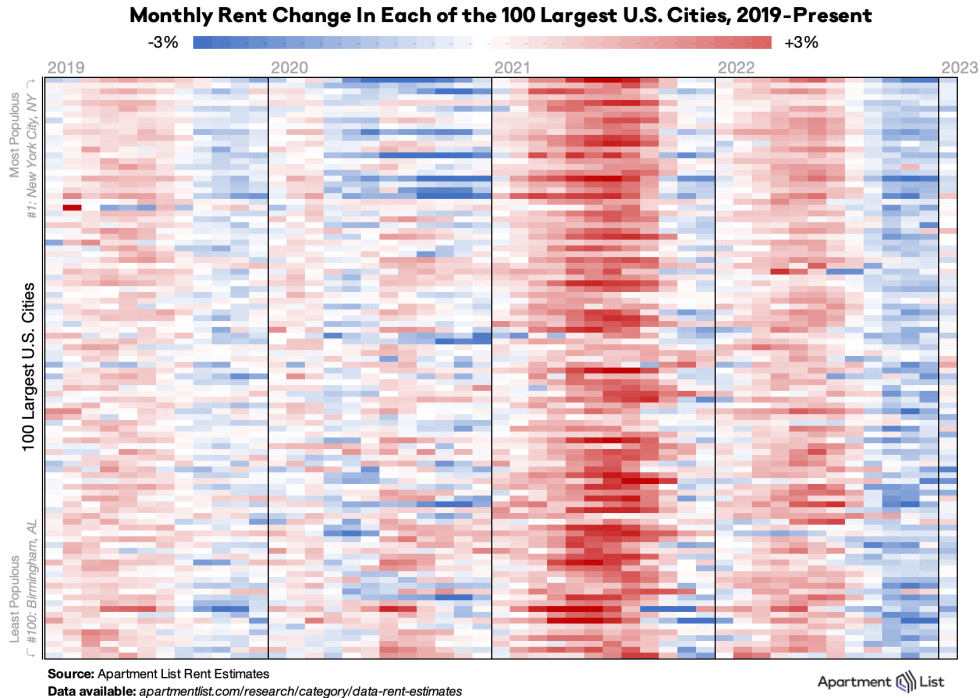
Rents decreased this month in 67 of the nation’s 100 largest cities, while an additional 8 cities saw prices remain flat. The largest city-level decline this month was in Newark, NJ, where rents fell sharply by 2.8 percent from December to January. Boise, ID also continued to see prices slide sharply by 2.1 percent. San Francisco (-1.1 percent) and Seattle (-0.9 percent) both saw prices dip at more than triple the national rate – with recent layoffs signaling a downturn in tech, there is reason to believe that these markets may remain soft throughout the course of this year. For a more detailed exploration of the insights to be gleaned from this visualization, see our interactive writeup here.
Indianapolis is the nation’s hottest rental market
Major markets throughout the Sun Belt have experienced truly disruptive levels of rent growth since the start of the pandemic, but over the past year, the fastest growth has actually been occurring in the Midwest. The following table shows the ten metropolitan areas that have experienced the fastest rent growth over the past six months, over the past year, and since the pandemic started in March 2020:
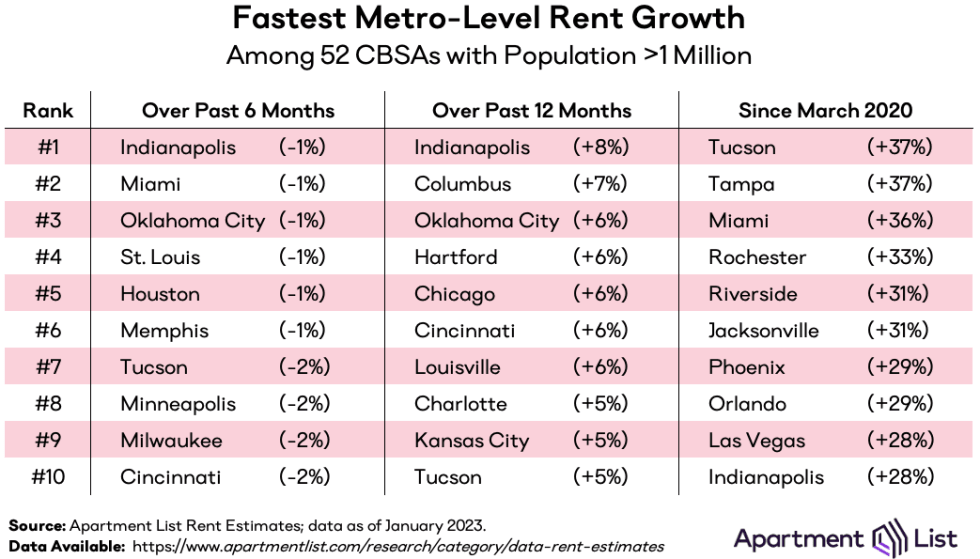
Indianapolis has seen the nation’s fastest metro-level rent growth over the past 12 months, with prices there up by 7.9 percent year-over-year. In addition to Indianapolis, four other Midwestern metros – Columbus, Chicago, Cincinnati, and Kansas City – rank among the top 10 for fastest annual rent growth. With many previously affordable Sun Belt markets having seen rents spike by 30 percent or more over the past two and a half years, markets in the Midwest may now represent some of the last bastions of affordability, and could therefore be drawing new attention.
That said, given the recent rental market cooldown, even the metros currently topping this list are experiencing relatively modest growth compared to what we were seeing in 2021 and the first half of last year. As recently as last July, all but a handful of the 52 metros with a population over one million logged year-over-year growth rates greater than Indianapolis’s current 7.9 percent rate which is now the nation’s fastest. And over the past six months, every single large metro has seen prices fall.
The Bay Area rental market continues to sputter
The San Francisco metro experienced the nation’s sharpest rent decline in the first year of the pandemic, and has been the slowest market to recover in the time since then. In recent months, that sluggishness has continued with a seasonal slowdown. Metro-wide, Bay Area rents fell by 0.9 percent in December and are down by 5.4 percent since August, both figures representing a much sharper cooldown than the national average.
The neighboring San Jose metro has experienced an even sharper decline of 6.7 percent over the past five months, which has brought that metro’s median rent back below its March 2020 level. San Francisco and San Jose are the only two large metros where the median rent is currently cheaper than it was at the pandemic’s onset. And at the city-level, some markets in the San Francisco Bay Area are recovering even more slowly, particularly in the more densely populated core cities. In Oakland, rents are still down 14.9 percent compared to March 2020 – the biggest discount among the 100 largest cities – while in San Francisco proper, rents are still down 13.5 percent. As noted above, softness in the tech industry is likely to prevent a strong rebound in Bay Area rents.
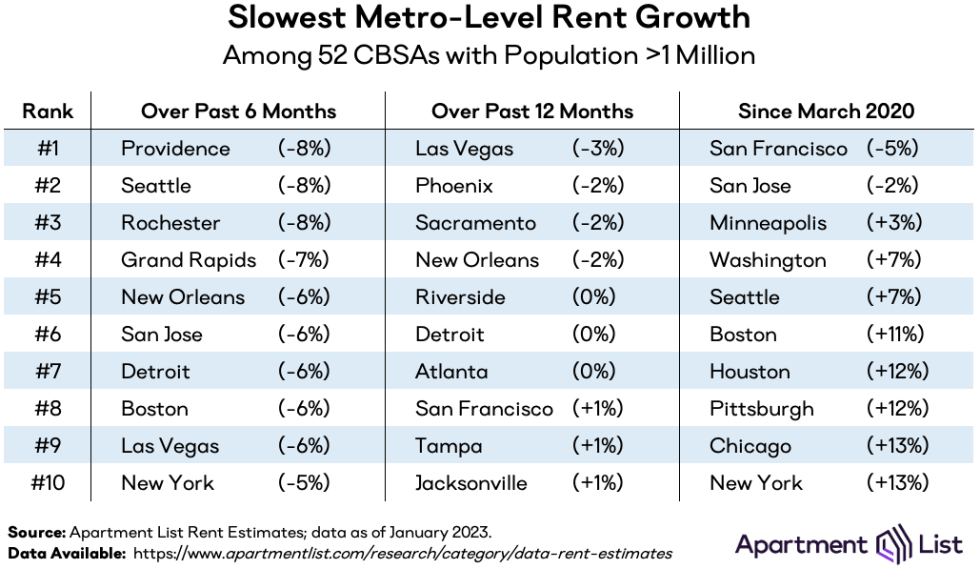
After San Francisco and San Jose the right-most column of the table is largely populated by other pricey coastal metros, including Washington, D.C.; Seattle; Boston; and New York. Even as many of these markets have rebounded over the past year and a half, they have still had among the most modest rent growth over the course of the pandemic as a whole. That said, just five metros have experienced rent growth of less than 10 percent over the past two and a half years.
Notably, the table above also shows how some of the markets that had been booming fastest are now showing signs of cooling off. For example, over the past year, prices are slightly down in Las Vegas (-3 percent) and Phoenix (-2 percent), despite the fact that both metros rank among the top ten for fastest pandemic-era rent growth. Riverside, Tampa, and Jacksonville similarly rank in the top 10 for both fastest growth since March 2020 and slowest growth over the past year.
Conclusion
With January’s 0.3 percent decline, rent prices have now dipped nationally for five consecutive months. Year-over-year rent growth now stands at 3.3 percent, a rate that is just slightly above the average of pre-pandemic years. This recent cooldown is indicative of a shift in market conditions that goes beyond seasonality alone, as cooling demand collides with growing supply. We’re likely to see a return to positive rent growth as moving activity picks back up in the coming months, but we expect that growth will remain modest throughout 2023, and year-over-year growth rates are likely to continue dipping as monthly growth remains slower than the 2022 pace.
To learn more about the data behind this article and what Apartment List has to offer, visit https://www.apartmentlist.com/.


Sign up to receive our stories in your inbox.
Data is changing the speed of business. Investors, Corporations, and Governments are buying new, differentiated data to gain visibility make better decisions. Don't fall behind. Let us help.


Sign up to receive our stories in your inbox.
Data is changing the speed of business. Investors, Corporations, and Governments are buying new, differentiated data to gain visibility make better decisions. Don't fall behind. Let us help.