
Back in November of 2022 monthly national average effective rent growth for new leases fell into negative territory for the first time since 2020. At that time, the negative movement was most pronounced in primary markets. In December, negative growth spread into the larger secondary markets, referred to by ALN as Tier Two markets. With one month of 2023 data now in the books, January looked a little bit like an improvement in some ways, but average effective rent regression has not entirely disappeared.
As usual, all numbers will refer to conventional properties of at least 50 units.
National Rent Growth
Average effective rent growth for new residents dipped below zero on a monthly basis nationally in both November and December – though by less than a 50-basis point drop in each month. As already mentioned, this shift occurred first in the largest markets. Primary markets saw average effective rent decline by 0.4% in November of last year while secondary and tertiary markets managed to realize small gains. In December, primary markets continued to be on the wrong side of zero and were joined by secondary markets. Again, the December losses for each group were less than 50 basis points.
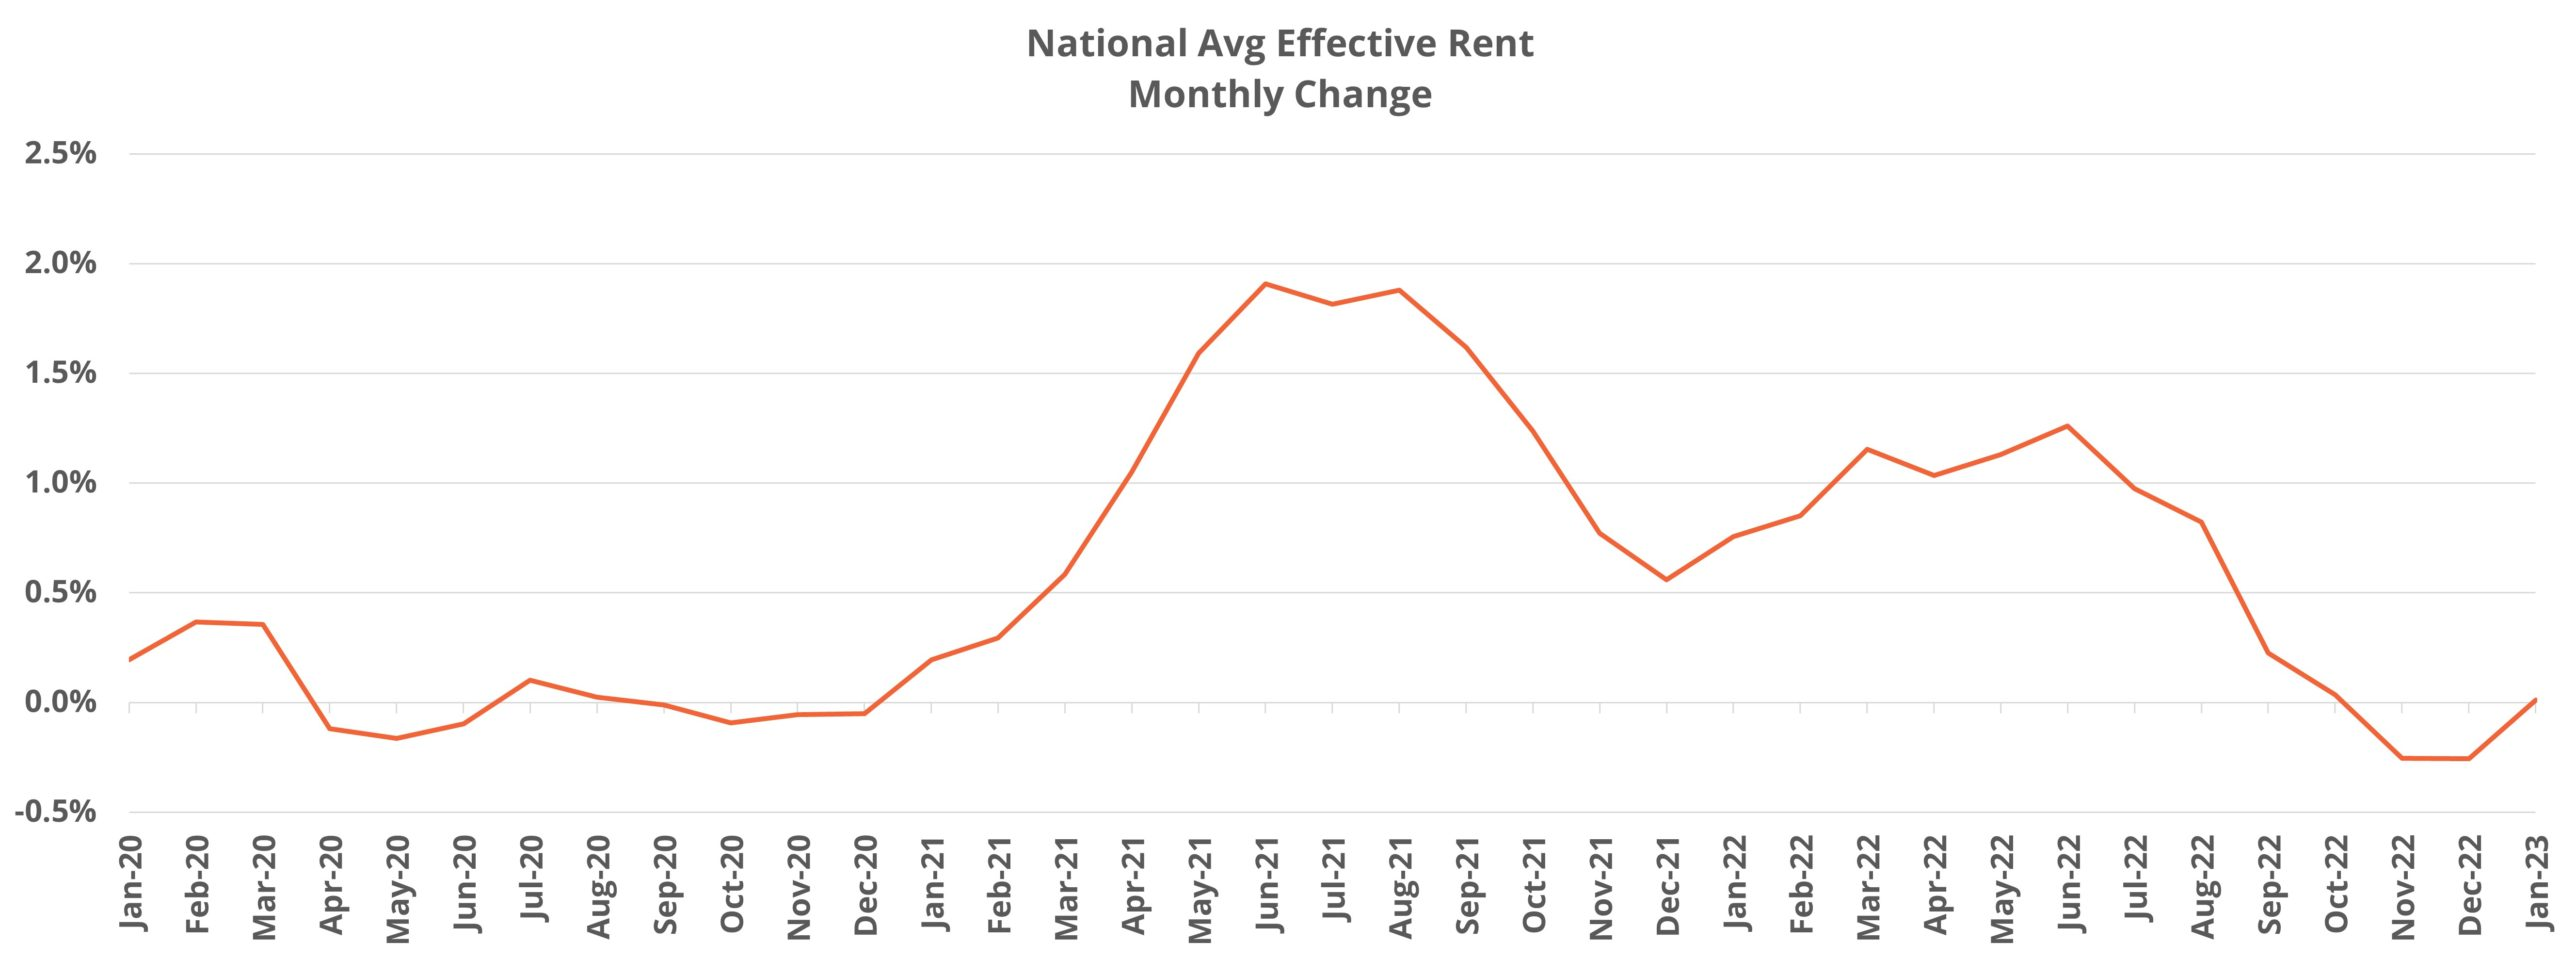
In January, national average effective rent was unchanged from December and closed the month at $1,676 per month for new leases. With January being part of the traditionally softer winter season for the multifamily industry, that rents did not continue their retreat was an encouraging sign. One month of data hardly constitutes a new trend, but a moderation of the negative movement in monthly net absorption in January combined with the change in trajectory for rent growth marked the first time in six months that both data points were not softening on a month-over-month basis.
Regional Differences
All ten of the NAA regions for the United States saw improvement from December to January in average effective rent. Region 7 and Region 10, comprised essentially of the West Coast along with Hawaii, Alaska, Idaho, Nevada, and Arizona, were the only two regions to lose ground in average rent for January.
For the most part, the larger markets in these regions were on the negative side of the ledger. Boise, Las Vegas, and Anchorage each suffered average rent declines of just under 1%. Seattle, Phoenix, San Francisco-Oakland, Portland, Los Angeles, Tucson, Sacramento, and San Diego all gave ground in January – but each by 50 basis points or less.
The negative movement was not ubiquitous across these two regions. Areas like Flagstaff, Reno, San Joaquin Valley, and Spokane each added less than 1% to average effective rent in the period while Honolulu managed to gain almost 3%.
Four of the ten NAA regions had no movement in the average rent for January and one region gained only 0.1%. Partially aided by a relative lack of new supply, the 40-basis point gain in Region 5 (Midwest) was the highest monthly appreciation of any region.
Thanks to the relative dearth of new deliveries in January, almost every market in the region managed to add to average effective rent despite more than half of them suffering negative net absorption during the month. The only exception was Wichita where a 10-basis point decline in effective rent was a considerably smaller decrease than in most of the markets that lost ground in the aforementioned Western regions.
On the positive side, Omaha, NE and Springfield, MO average rents rose by about 1% each in January, and the gain in Columbia, MO was above 3%. Every other market in this region, from Oklahoma City to Des Moines to Kansas City found themselves with a gain between 0.1% and 0.5% in the period.
Price Class Differences
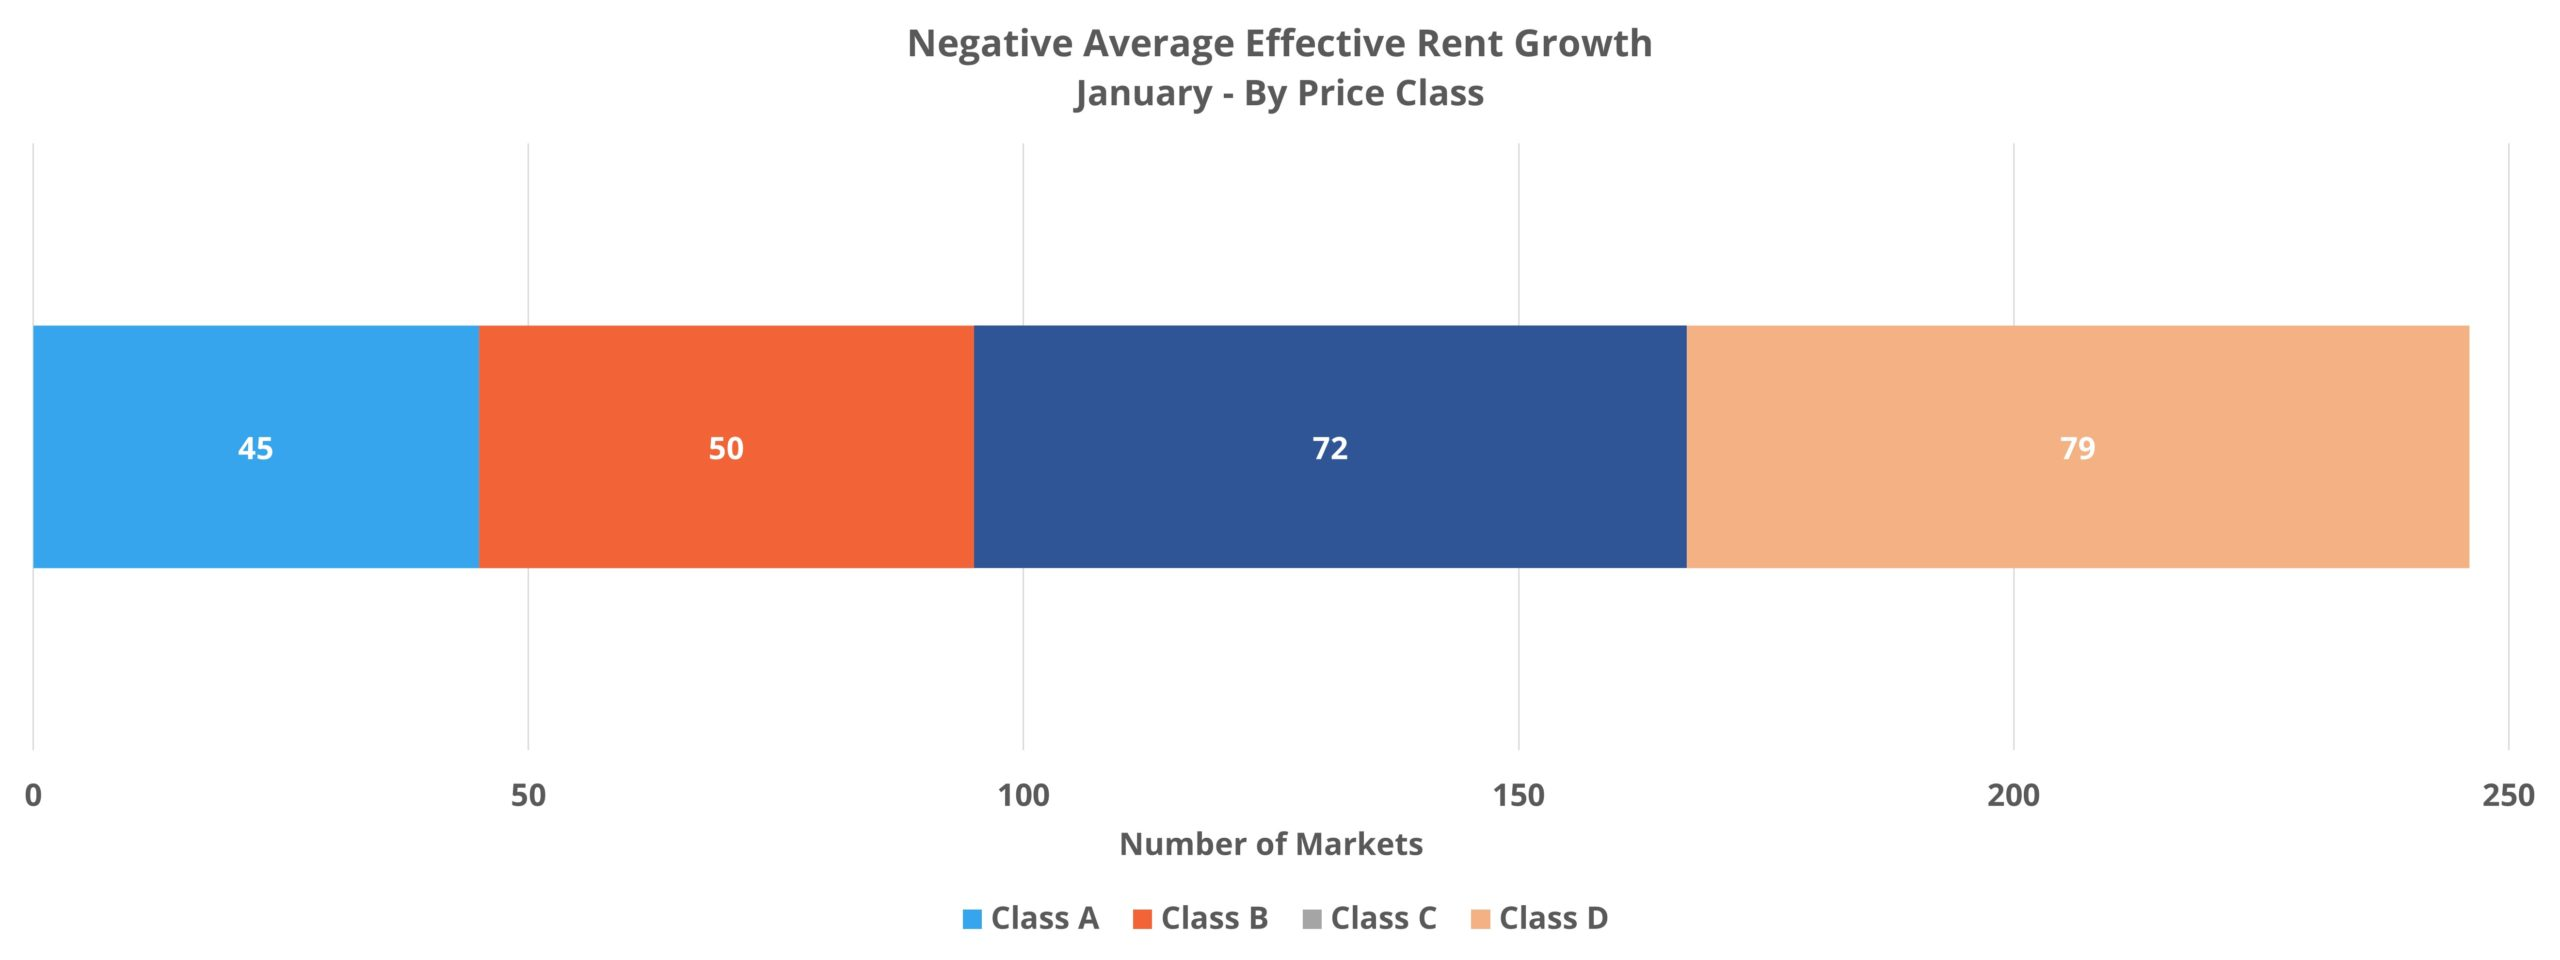
Although average effective rent change was negative for both the Class C and Class D subsets, all four price classes saw improvement in January from the preceding month. Class A continued to lead the way after being the only price class not to lose ground in December, but the January monthly gain was a paltry 0.2%. For Class B, average effective rent for new leases rose by 0.1% in the period.
For Class C properties, a 10-basis point decline in January was the fourth monthly decline in a row but represented an improvement from both November and December. A 0.3% decline at the average for the Class D group was the third consecutive monthly loss was similarly an improvement from the previous month.
When grouping Class C and Class D together to approximate a workforce housing category, the most pronounced rent retractions in January were mostly a smaller market phenomenon. Areas like Charleston, WV, Lake Charles, LA, South Bend, IN, Victoria, TX, Pensacola, FL, and Lexington, KY each lost around 2-3% in average effective rent in January within this segment.
The high-growth markets from recent years were also well-represented near the top of the list for average rent losses in the bottom two price tiers. Boise, Phoenix, Reno, Salt Lake City, Austin, Nashville, Raleigh-Durham, and Jacksonville all declined by more than 0.5% at the average with the 1.4% slide in Boise leading that group.
Takeaways
After two consecutive months in negative territory, monthly average effective rent for new leases managed to at least hold serve in January rather than continue its retreat. Although only one month of data, this development does provide an encouraging sign given that we are still a month away from spring which is typically when the multifamily industry sees some improvement in performance from the winter.
While negative rent growth did not entirely disappear in January, another encouraging sign was that month-over-month improvement was seen essentially across the board. This was the case regionally, by price class, and by market size.
National net absorption, while still slightly negative for January, improved for a third month in a row in concert with the January halt to the average effective rent decline. All of this lends some support to a cautiously optimistic outlook for the industry this year, but continued improvement on the demand side is going to be a necessity given the upcoming volume of new supply.
To learn more about the data behind this article and what ALN Apartment Data has to offer, visit https://alndata.com.


Sign up to receive our stories in your inbox.
Data is changing the speed of business. Investors, Corporations, and Governments are buying new, differentiated data to gain visibility make better decisions. Don't fall behind. Let us help.


Sign up to receive our stories in your inbox.
Data is changing the speed of business. Investors, Corporations, and Governments are buying new, differentiated data to gain visibility make better decisions. Don't fall behind. Let us help.