Academic research from NYU, Stanford, Harvard, Oxford, and other leading universities tap into SafeGraph datasets to uncover the increasingly partisan response to stay-at-home orders during the Coronavirus pandemic
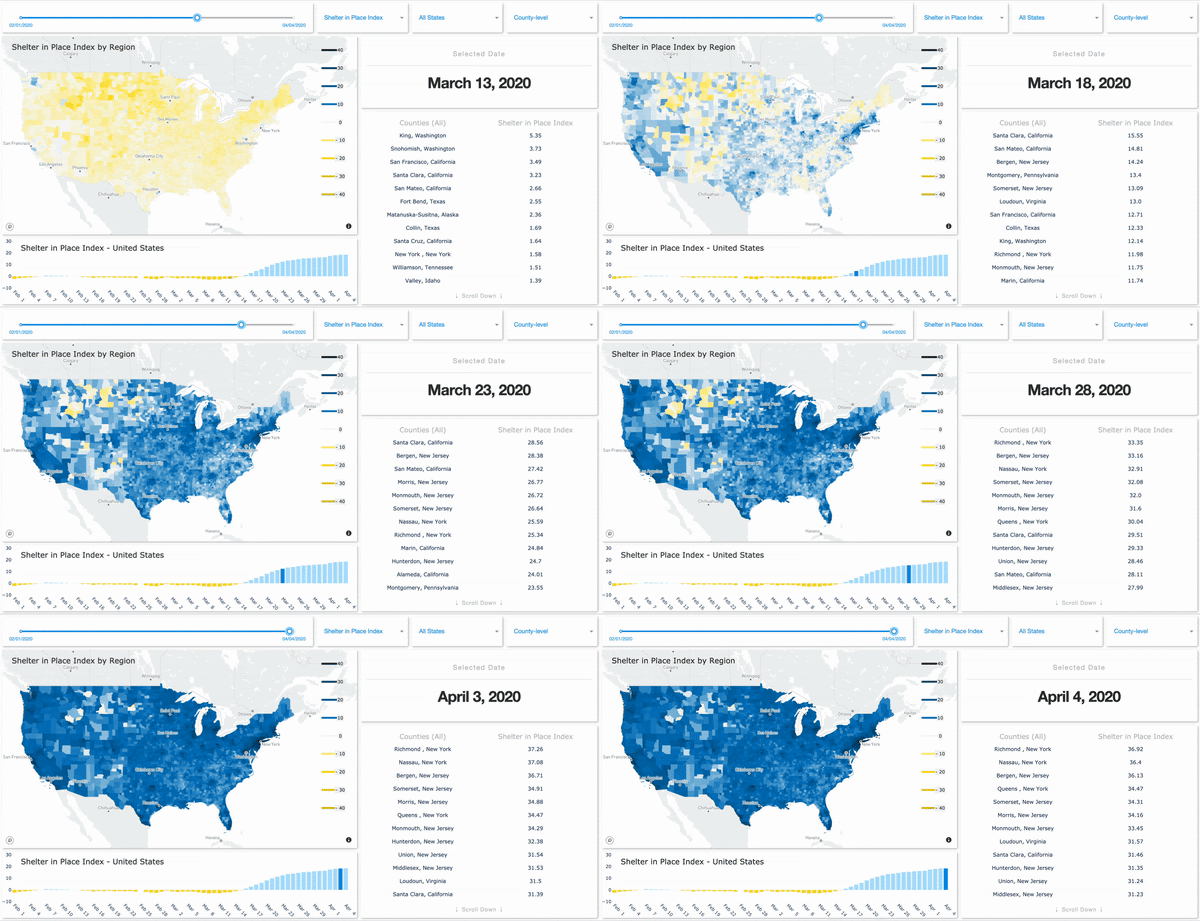
Social distancing and stay-at-home measures are in full swing across the U.S. But as SafeGraph’s Shelter-In-Place dashboards show, not everyone is hunkering down at home in the same way. This begs the question: what’s driving these different responses in each state?

SafeGraph’s Shelter-In-Place dashboard shows regional variability in social distancing adherence.
Using SafeGraph’s social distancing metrics dataset, four different academic research teams from some of the world’s leading universities looked to politics—more specifically, the partisan divide—as a way of answering this question.

Research conducted as part of SafeGraph’s COVID-19 data consortium, which includes 80+ university partners.
Hunt Allcott (New York University, Microsoft Research, and NBER), Levi Boxell (Stanford), Jacob Conway (Stanford), Matthew Gentzkow (Stanford and NBER), Michael Thaler (Harvard), and David Yang (Harvard)
The general assumption that sparked this research was that Republicans were social distancing less, on average, than Democrats at the onset of the COVID-19 outbreak. It was uncertain, however, whether this was directly tied to the urban versus rural divide—knowing that most urban areas in the country tend to skew Democrat—or if it was because Democrat-leaning counties were the hardest hit when the virus first landed on U.S. shores and, thus, began implementing stay-at-home measures earlier than other parts of the country.

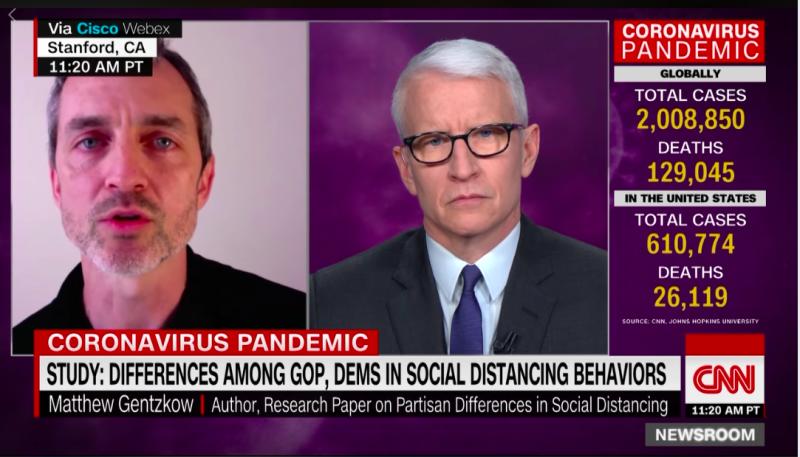
Matthew Gentzkow from Stanford explaining his findings to Anderson Cooper.
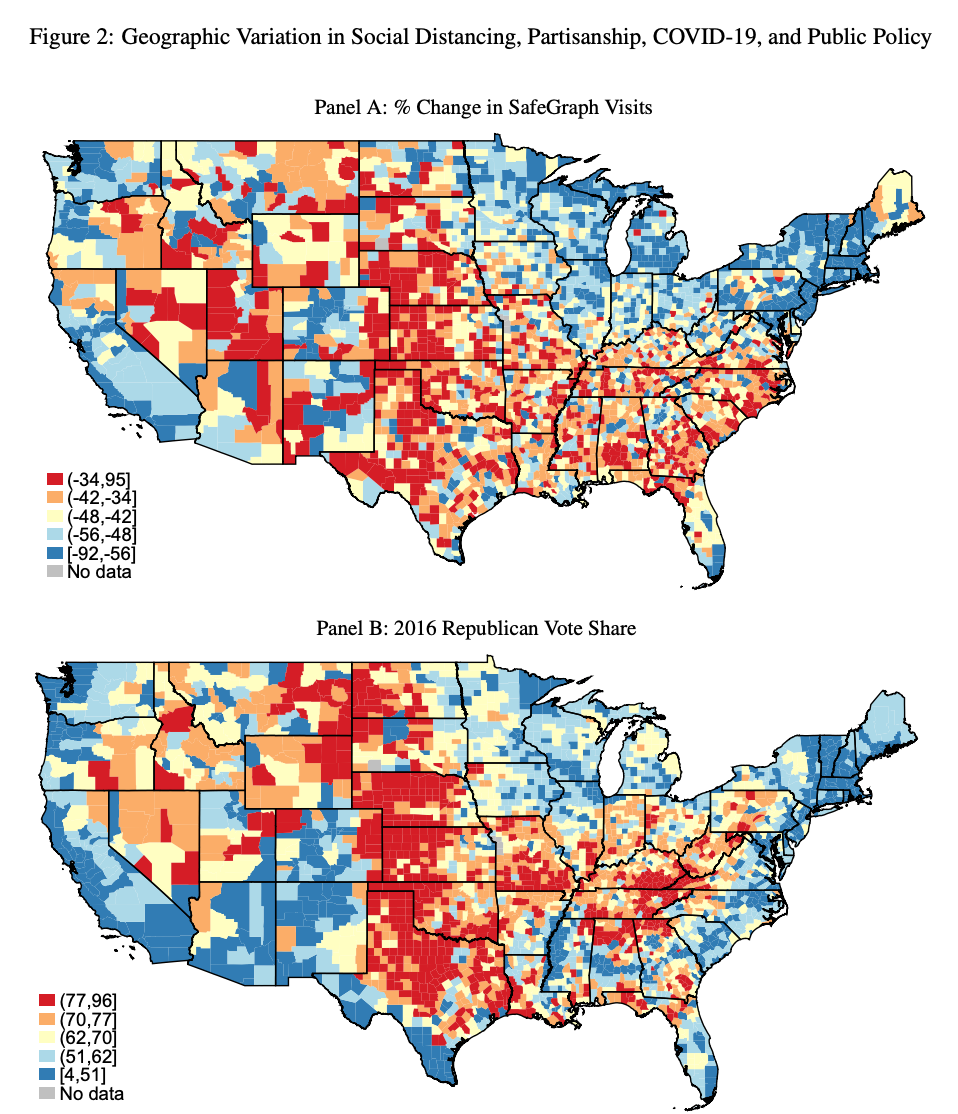
But after controlling for the potential Democrat-leaning bias in urban areas, these researchers were able to lean into SafeGraph’s social distancing dataset to uncover the real partisan gap at play here. They found their initial assumption to be true: Republican counties were much less likely to practice social distancing at the beginning of this health crisis than their Democratic counterparts. In fact, the difference between a county in the bottom 10th percentile of Republican vote share versus one with a 90th percentile Republican vote share could point to as much as an 18.6% increase in foot traffic to local businesses during the week of March 29, 2020.

Counties complying less with social distancing orders (shaded red in Panel A) map to
counties that voted predominantly Republican in the 2016 election(shaded red in Panel B).
Similarly, counties complying more with social distancing orders (shaded blue in Panel A) map to
counties that voted predominantly Democrat in the 2016 election(shaded blue in Panel B).
Marcus Painter (Saint Louis University) and Tian Qiu (University of Kentucky)
This paper sought to understand the level of compliance with social distancing and stay-at-home orders at the county level, based on the political party of those residents alone. Then, it went one ideological step further to assess whether the political party of a state’s governor had any impact on whether residents complied with various health and safety measures.
Using SafeGraph’s social distancing dataset, it was first found that counties having voted for Trump in the 2016 election were less responsive to social distancing orders, generally speaking. Second, though not necessarily surprising, it was also found that Democratic-leaning counties responded less to social distancing orders when issued by a Republican governor; the same is true for the response of Republican-leaning counties towards a measure imposed by a Democratic governor. This signals an incredible need to drive bi-partisan support for such measures to be taken seriously by all.
Overall, these researchers were able to find that, in states having implemented a state-wide social distancing policy, the proportion of people actually staying at home is 5.1 percentage points higher than in states with no formal policies whatsoever.
Martin Anderson (UNC-Greensboro)
This paper also explored the impact of partisanship on voluntary adherence to social distancing measures through the lens of media consumption: in other words, how people interpret or respond to communications from political leaders can greatly shape their perceptions and behaviors towards social distancing and stay-at-home measures.
One of the most striking results of the study found that a one percentage point increase in CNN viewership in a given county was directly associated with a 10 percentage point reduction in visits to local businesses and other points-of-interest—with this number growing steadily until the middle of March 2020. Conversely, Fox News viewership had the opposite effect, leading residents to increase their visits to local businesses in a given county. This is a perfect example of the strong ideological influence that different media outlets can hold over their viewers, having the power to shape how they perceive messages from political leaders.
Adam Brzezinski (Oxford), Guido Deiana (Oxford), Valentin Kecht (Oxford), David Van Dijcke (Oxford)
This paper is focused less on partisanship, per se, and more about at what point do governments need to intervene to ensure that social distancing and stay-at-home measures are being respected. The key takeaway here, fueled by SafeGraph social distancing datasets, is that people are more likely to voluntarily follow these measures when their local area has been greatly affected by COVID-19. It’s only when communities do not take social distancing measures seriously on their own that governments must then enforce lockdown measures to mitigate the virus’s spread.
Academic researchers, non-profits, and government organizations: Join SafeGraph’s COVID-19 Data Consortium to get SafeGraph data at no-cost.
If you are with a for-profit business, please contact our team today to learn how these datasets can help your business navigate this unfolding health and economic crisis.
To learn more about the data behind this article and what SafeGraph has to offer, visit https://www.safegraph.com/.


Sign up to receive our stories in your inbox.
Data is changing the speed of business. Investors, Corporations, and Governments are buying new, differentiated data to gain visibility make better decisions. Don't fall behind. Let us help.


Sign up to receive our stories in your inbox.
Data is changing the speed of business. Investors, Corporations, and Governments are buying new, differentiated data to gain visibility make better decisions. Don't fall behind. Let us help.


