
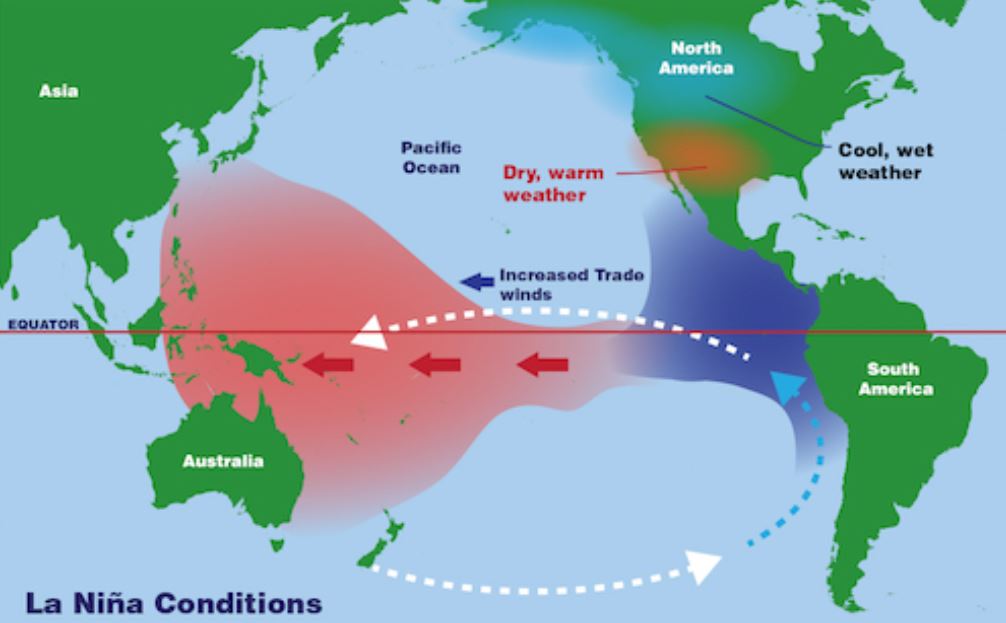
What is a La Niña year?
With a La Niña event already arriving, aWhere analysts reviewed what a typical La Niña year looks like in southern regions of South America. Looking at aWhere’s historical, observed data for the 2011-2012 La Niña event, we can better understand the implications for rainfall patterns and the challenges this region could face. Agriculture in this area is an important economic activity and it was greatly impacted by the 2011-2012 La Niña event. We will examine this in more depth in this report.
According to the Earth Institute at Columbia University, most of the atmospheric variables in mid-September were consistent with La Niña conditions. La Niña events typically recur every 2 to 7 years and last about 9-12 months. NOAA has issued a La Niña advisory for this year meaning the conditions present in August and September are likely to persist.
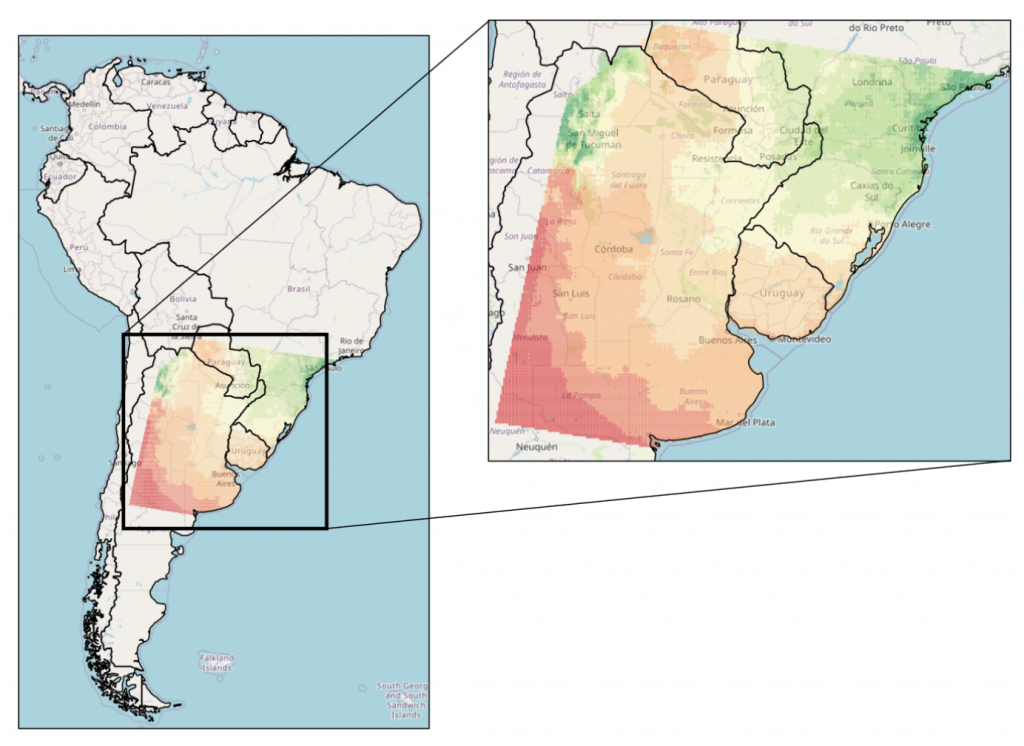
The area of study in South America is shown below.
What we learned from the last La Niña (2011-2012)
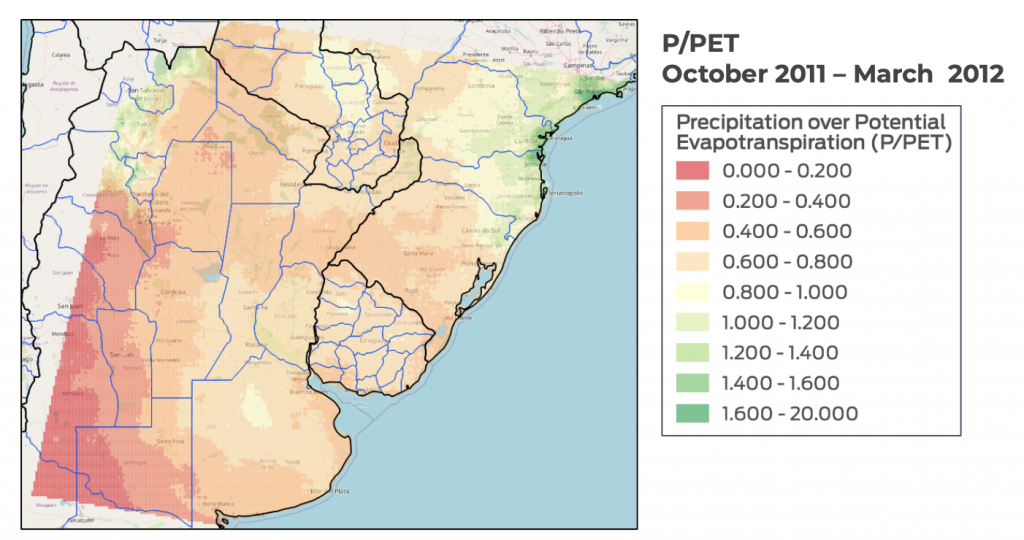
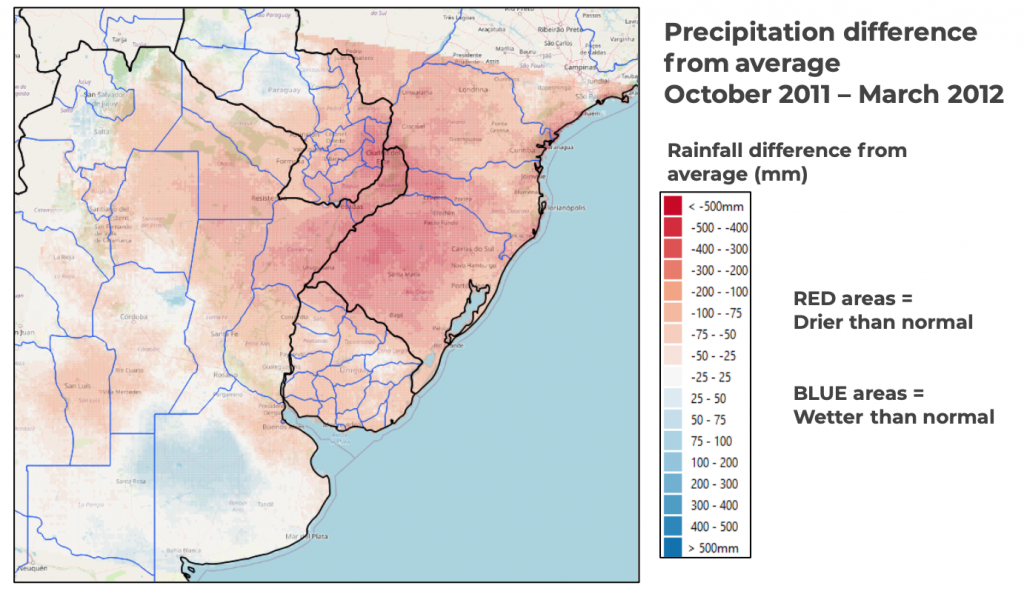
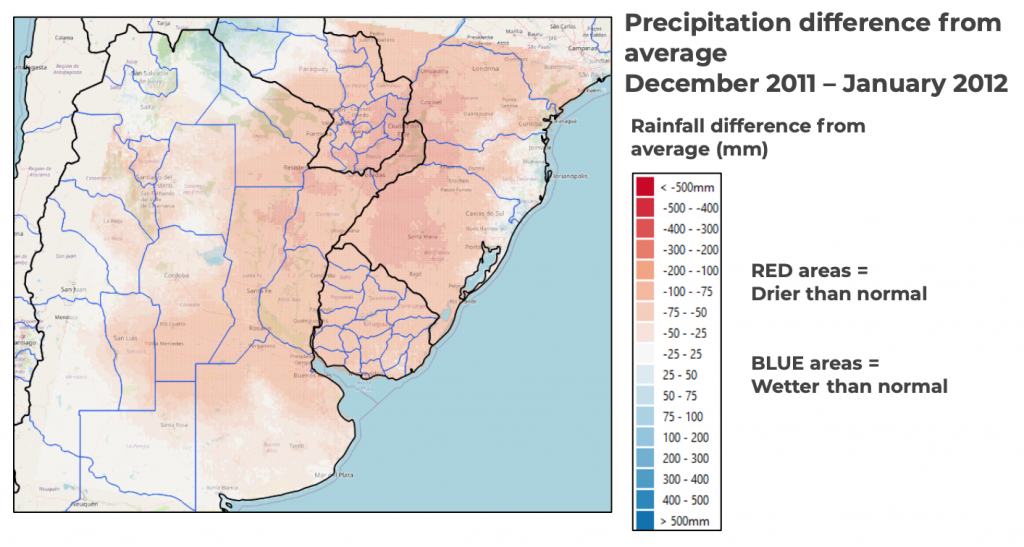
The La Niña of 2011-2012 produced dry conditions across most of southern South America. Lower than expected rainfall resulted in drought conditions as expressed by the ratio of precipitation / potential evapotranspiration (P/PET). These dry trends are shown in the maps below. P/PET less than 1.0 indicates dry conditions when the evaporative demand is greater than the precipitation. As P/PET falls below 0.80, most commercial crops suffer increasing damage due to drought stress. The two maps below show the weather patterns during October 2011 – March 2012.
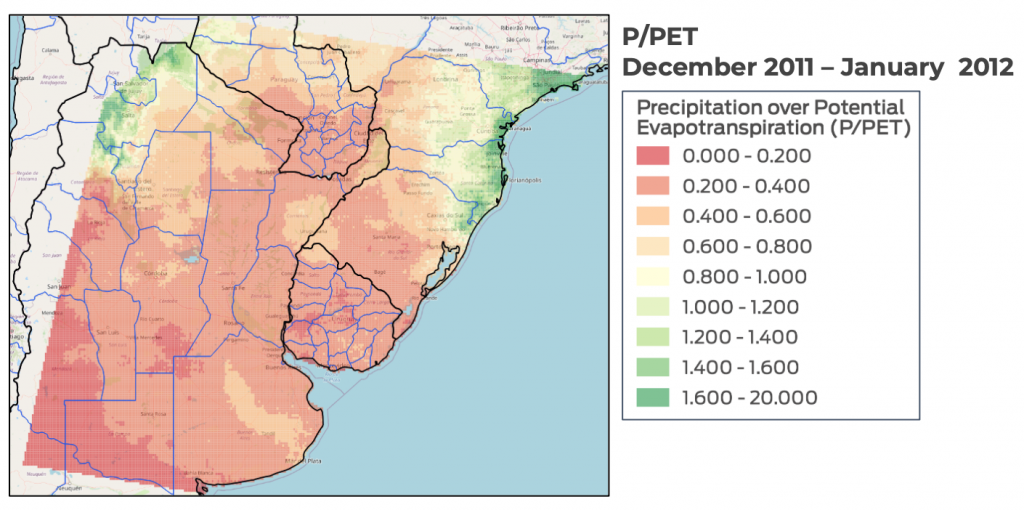
Review of key months December 2011 & January 2012
The La Niña of 2011-2012 during the growing season produced much drier than expected conditions during the key months of December (2011) and January (2012). Dry conditions, P/PET of less than 0.80 were prevalent across much of the region. 62 days with an average P/PET of less than 0.80 (all the orange to red areas below) would predict significant water stress in essentially all commercial crops without irrigation.
Climate Trends
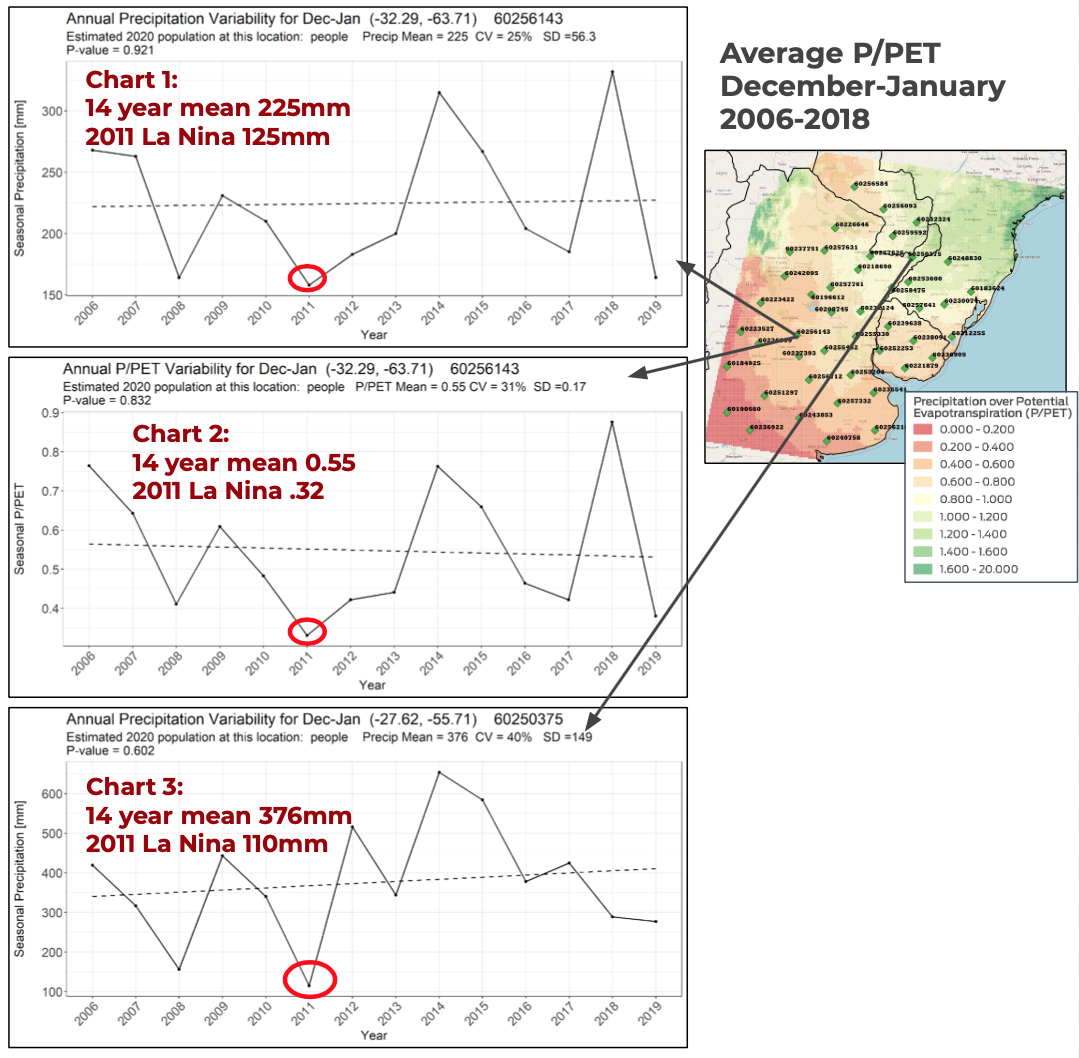
In the charts below, we show the precipitation pattern (Chart 1) and then P/PET (Chart 2) for a specific geolocation. The patterns are quite similar but P/PET enables translation to understand the impact on crop production. The 2011 La Niña was very dry as was this last 2019-2020 season. Most commercial agricultural crops would require irrigation in this area. Chart 3 shows very dry conditions for the 2011-2012 La Niña year, that location averages 376 mm of rainfall from December- January but in 2011-2012, just 110 mm of rain fell. This deficit of over 200 mm will impact rainfed crop production.
Implications
Drier than normal conditions are expected in the 2020-2021 growing season. Rainfed farmers will likely be severely impacted. Farmers must be alerted to this risk and government and industry prepared to provision relief irrigation to mitigate crops losses due to regional drought conditions.
To learn more about the data behind this article and what aWhere has to offer, visit https://www.awhere.com/.


Sign up to receive our stories in your inbox.
Data is changing the speed of business. Investors, Corporations, and Governments are buying new, differentiated data to gain visibility make better decisions. Don't fall behind. Let us help.


Sign up to receive our stories in your inbox.
Data is changing the speed of business. Investors, Corporations, and Governments are buying new, differentiated data to gain visibility make better decisions. Don't fall behind. Let us help.