The holiday season approaches, and another quarter is in the books. The second quarter was a rough one for multifamily, as with the broader economy, but some positive signs emerged in the last few months. This month we take a closer look at Q3 performance and, as always, numbers will refer to conventional properties of at least 50 units.
Third Quarter Supply and Demand
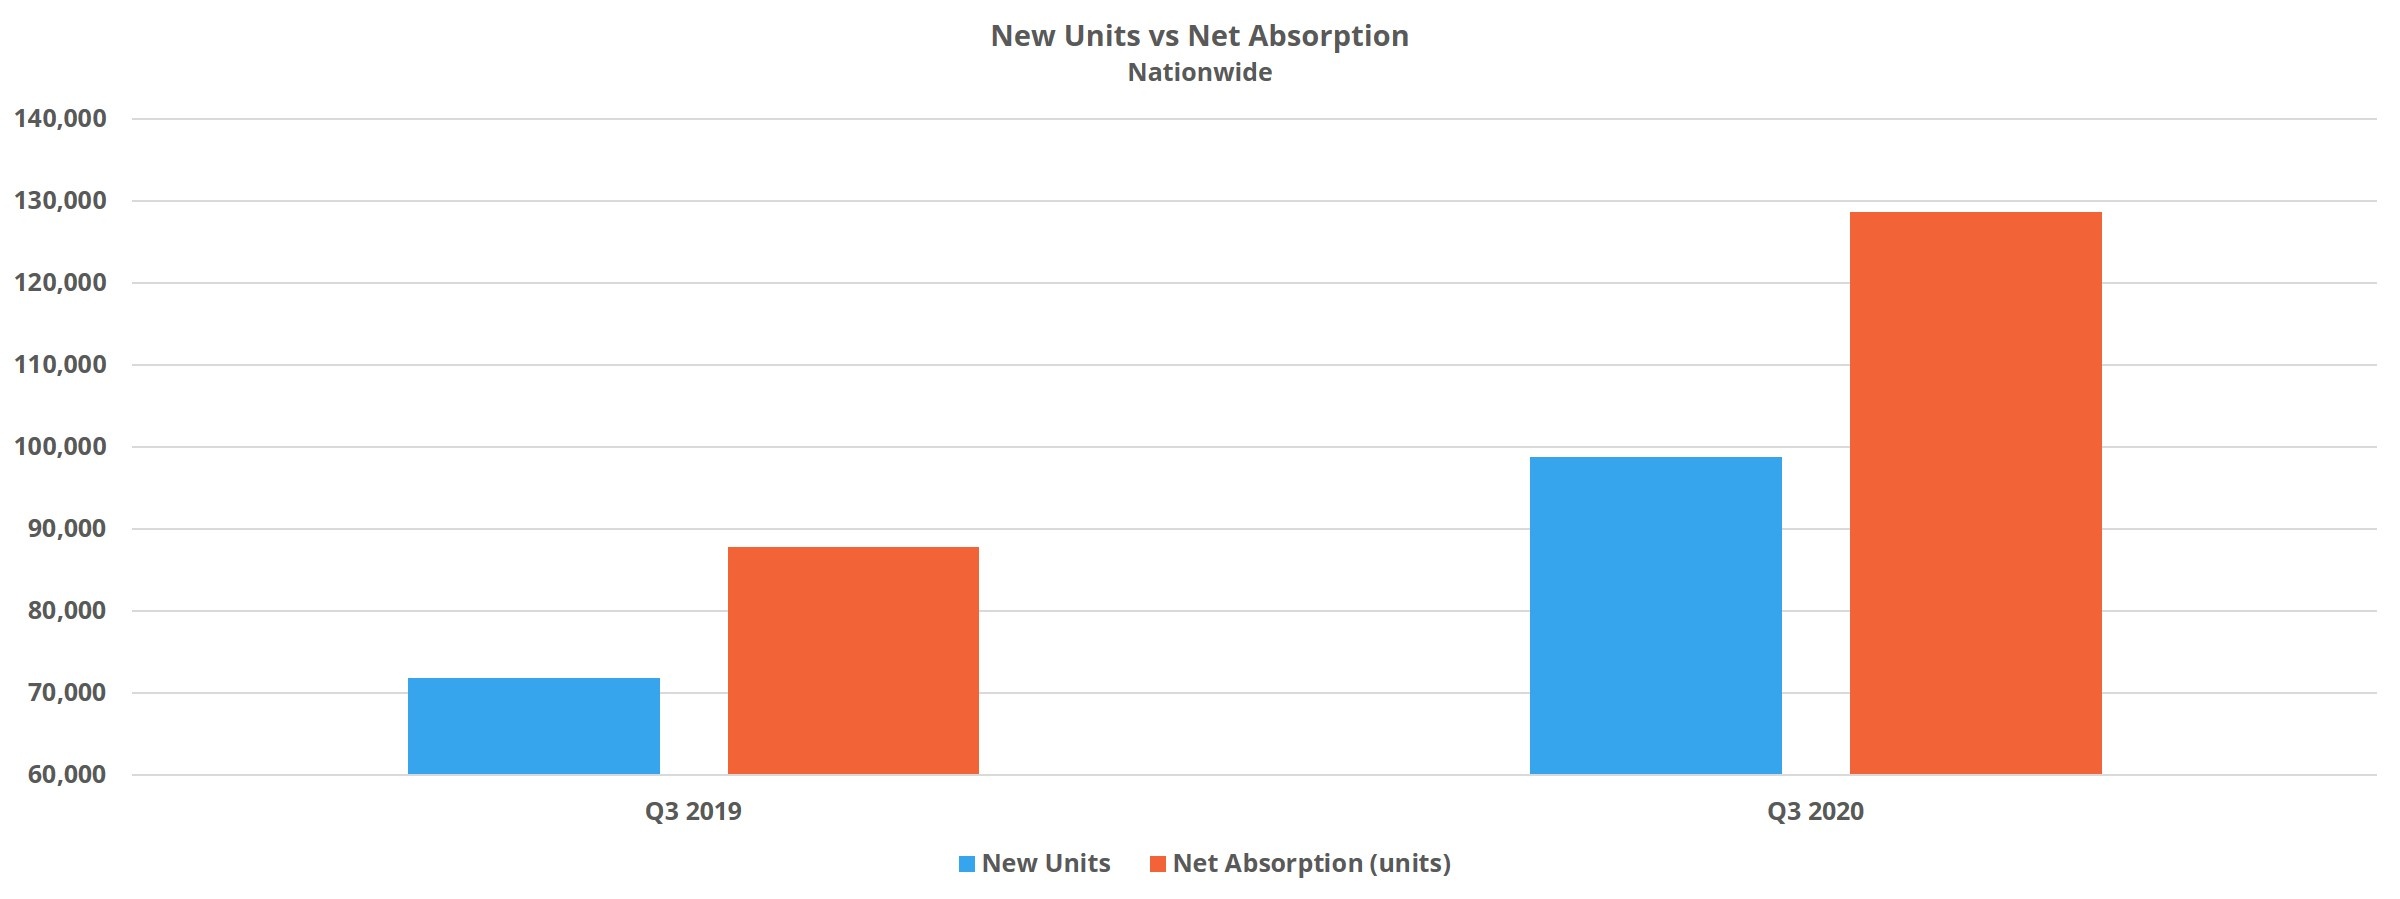
The new construction pipeline was a force in the quarter, delivering more than 90,000 units. In the same period last year, only around 72,000 new units were delivered. Given the precipitous decline in multifamily demand through the first half of the year, the timing of this new supply had the potential to cause real disruption.
Fortunately, the seasonally strong third quarter managed to outpace demand from the same period last year – and by a solid margin. Net absorption in the quarter of more than 125,000 units compared quite favorably to net absorption of about 88,000 units in Q3 2019. So where was this resurgence in demand? The first part of the answer is in the lower price tiers. ALN assigns conventional properties to one of four price tiers, A through D, based on the property’s average effective rent per square foot percentile in its market.
In the third quarter, Class A net absorption was about half of that in Q3 2019. In Class B, quarterly demand was roughly on par with last year. In Class C properties, more than six times as many net units were absorbed in the third quarter than in that same period last year. In Class D properties, net absorption moved from a net loss of 500 units last year to a net gain of more than 17,000 rented units in the third quarter this year.

Another piece of the resurgent demand puzzle is that a dozen or more large markets significantly outperformed in the quarter compared to last year. Not all of them will be covered here, but a few stood out. In Atlanta, net absorption doubled that of Q3 2019 with a net gain of about 7,500 rented units. In Dallas – Fort Worth demand was about 40% higher than last year with more than 10,000 net absorbed units. That was the highest mark of any market. Lastly, an area that doesn’t typically get as much attention – Detroit. In the third quarter last year, Detroit suffered a net loss of about 500 rented units. This year, about 3,500 previously vacant units were leased.
It also should be mentioned that it’s likely pent-up demand from earlier in the year at the height of the pandemic and economic destabilization was partially realized in the third quarter. All told, average occupancy ticked up slightly, by less than 0.5%, to end September at 92%.
Third Quarter Average Effective Rent and Lease Concessions
At the national level then, and indeed at the market level for many areas of the country, the supply and demand balance in the third quarter was quite healthy. Certainly, healthier than in earlier portions of 2020. However, not all is yet well, as evidenced by anemic rent growth in a portion of the year in which rent growth is traditionally strong.
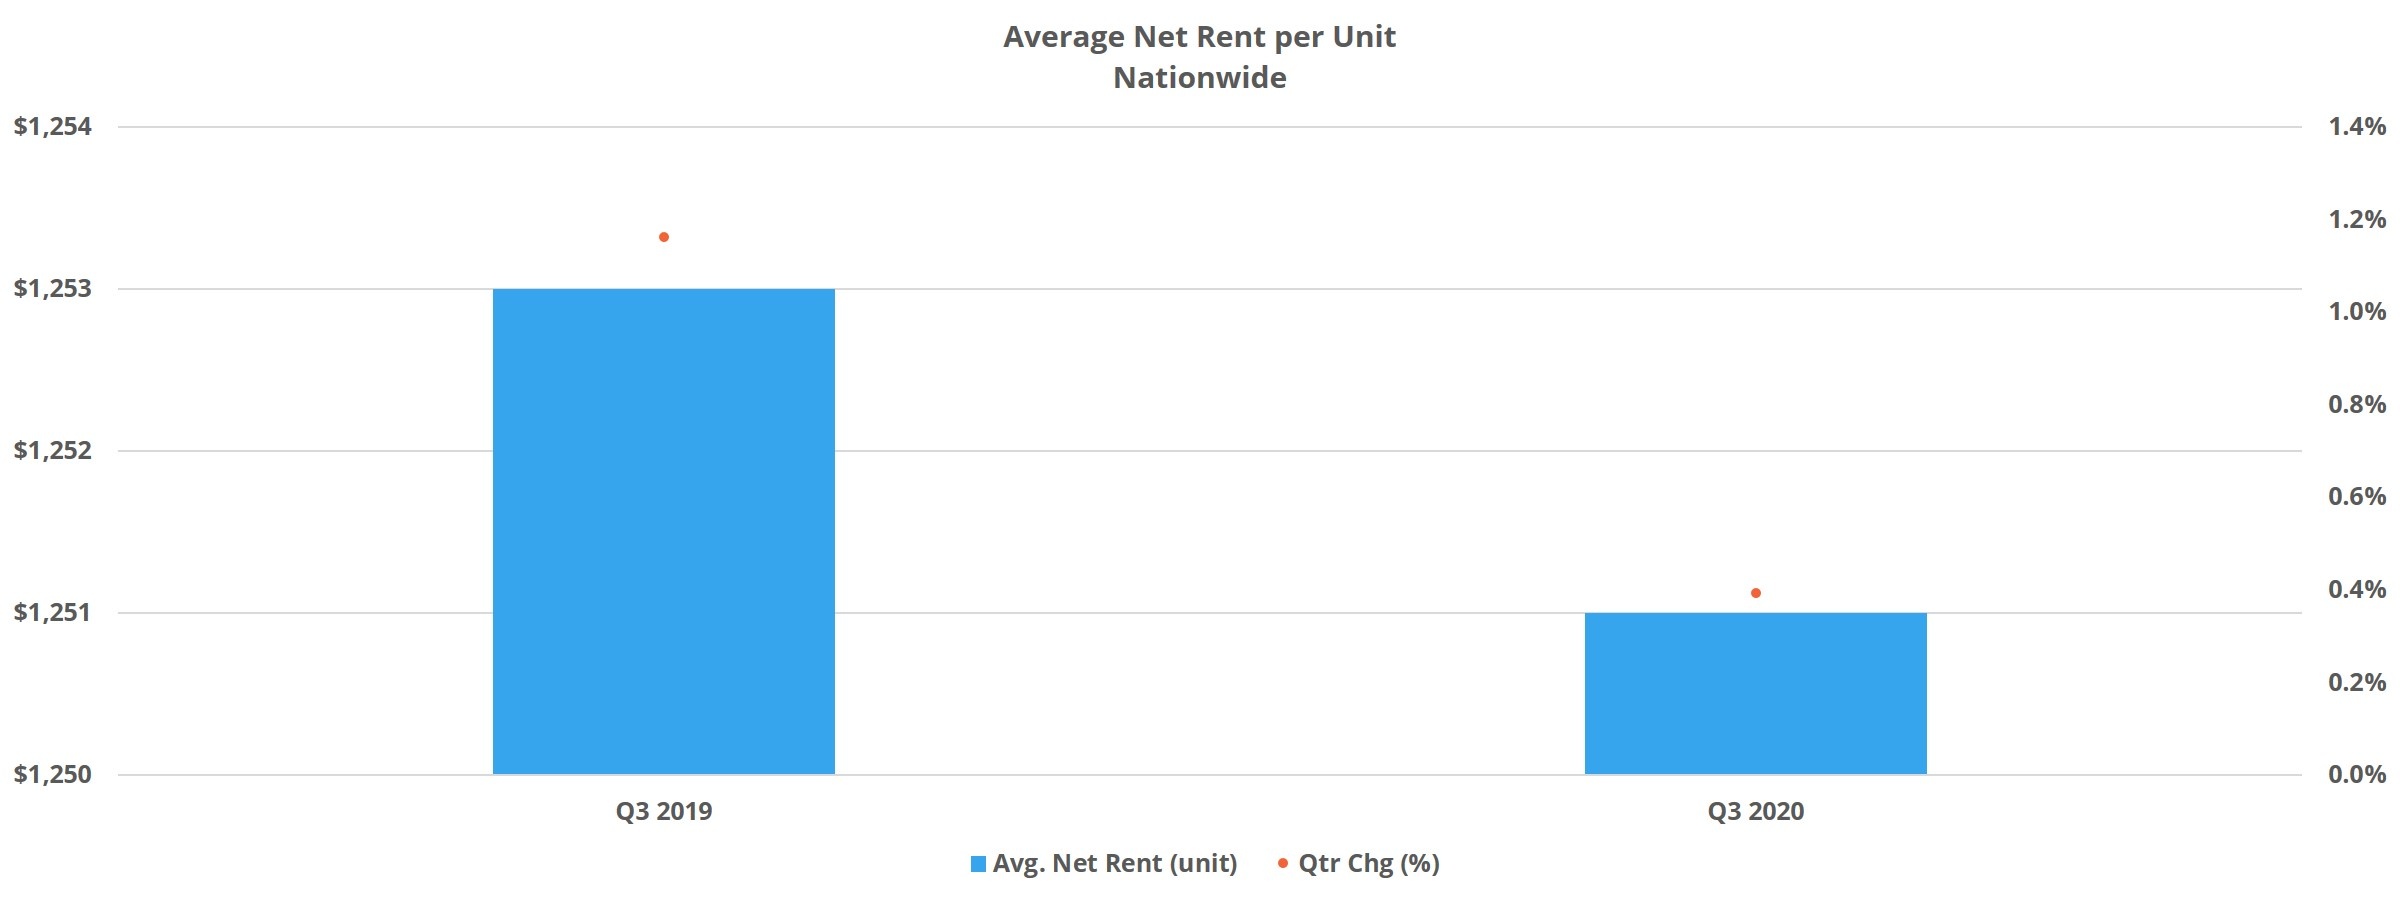
Average effective rent rose by 0.1% in the quarter nationally to end September at $1,363 per unit. To the extent there was rent growth, it came from lease-up properties. For properties that entered the quarter already stabilized, average effective rent growth declined by 0.1% after managing a 0.7% increase in the same period last year.

As with demand, the top two price tiers predictably struggled on the rent front and each declined by around 0.5%. Unlike with demand, however, the lower two price tiers did not outperform last year’s figures. Class C properties gained 0.3% in average effective rent and Class D properties declined by 0.1%. Given that non-stabilized properties were responsible for the small overall rent gain nationally, and also that Class A was hardest hit in rent growth, stabilized Class A properties were especially impacted.
One element that continues to act as a headwind for rent growth, even as demand reemerges, is rent concessions. After a 4% increase in the quarter, approximately 19% of conventional properties ended September offering a lease concession. At the end of Q3 2019 14% of properties were offering a discount.
Furthermore, it is not only the availability of concessions that continues to be elevated but the average discount value as well. After a 17% increase during the quarter, the average concession value was 7.5% off a 12-month lease. This average is calculated only from properties offering a discount and equates to one month off a 12-month lease. One other note is that more than a quarter of Class A properties finished September offering a lease concession with Class B right behind at 22%.
Takeaways
Net absorption through the first nine months of 2020 was only 70% of the total from 2019, and that is after a very strong third quarter. This puts into context just how rocky the first half of the year was for multifamily, but it is also a fantastic and welcome development in light of where the industry was just a few months ago.
More expensive properties continue to struggle to rebound toward previous levels of performance, making it clear residents remain especially price sensitive. This is also borne out by the fact that demand was very strong in Classes C and D, but operators chose to simply take the occupancy gains and didn’t, or couldn’t, press rents higher.
Concessions continue to increase in both availability and average value across price classes and among stabilized properties – not just lease-ups. Market conditions appear to have stabilized enough for now to allow a resurgence in demand and a buoying of occupancies, but not stabilized enough to begin generating notable rent growth and a draw down in concessions.
One other note is that the impact of eviction moratoriums on occupancies is difficult to precisely quantify at this time, but the number of occupied units is undoubtedly larger than the number of rent-generating units.
To learn more about the data behind this article and what ALN Apartment Data has to offer, visit https://alndata.com.


Sign up to receive our stories in your inbox.
Data is changing the speed of business. Investors, Corporations, and Governments are buying new, differentiated data to gain visibility make better decisions. Don't fall behind. Let us help.


Sign up to receive our stories in your inbox.
Data is changing the speed of business. Investors, Corporations, and Governments are buying new, differentiated data to gain visibility make better decisions. Don't fall behind. Let us help.


