Source: https://blog.apptopia.com/disney-reaches-100m-downloads-and-285m-iap-revenue-in-its-first-year
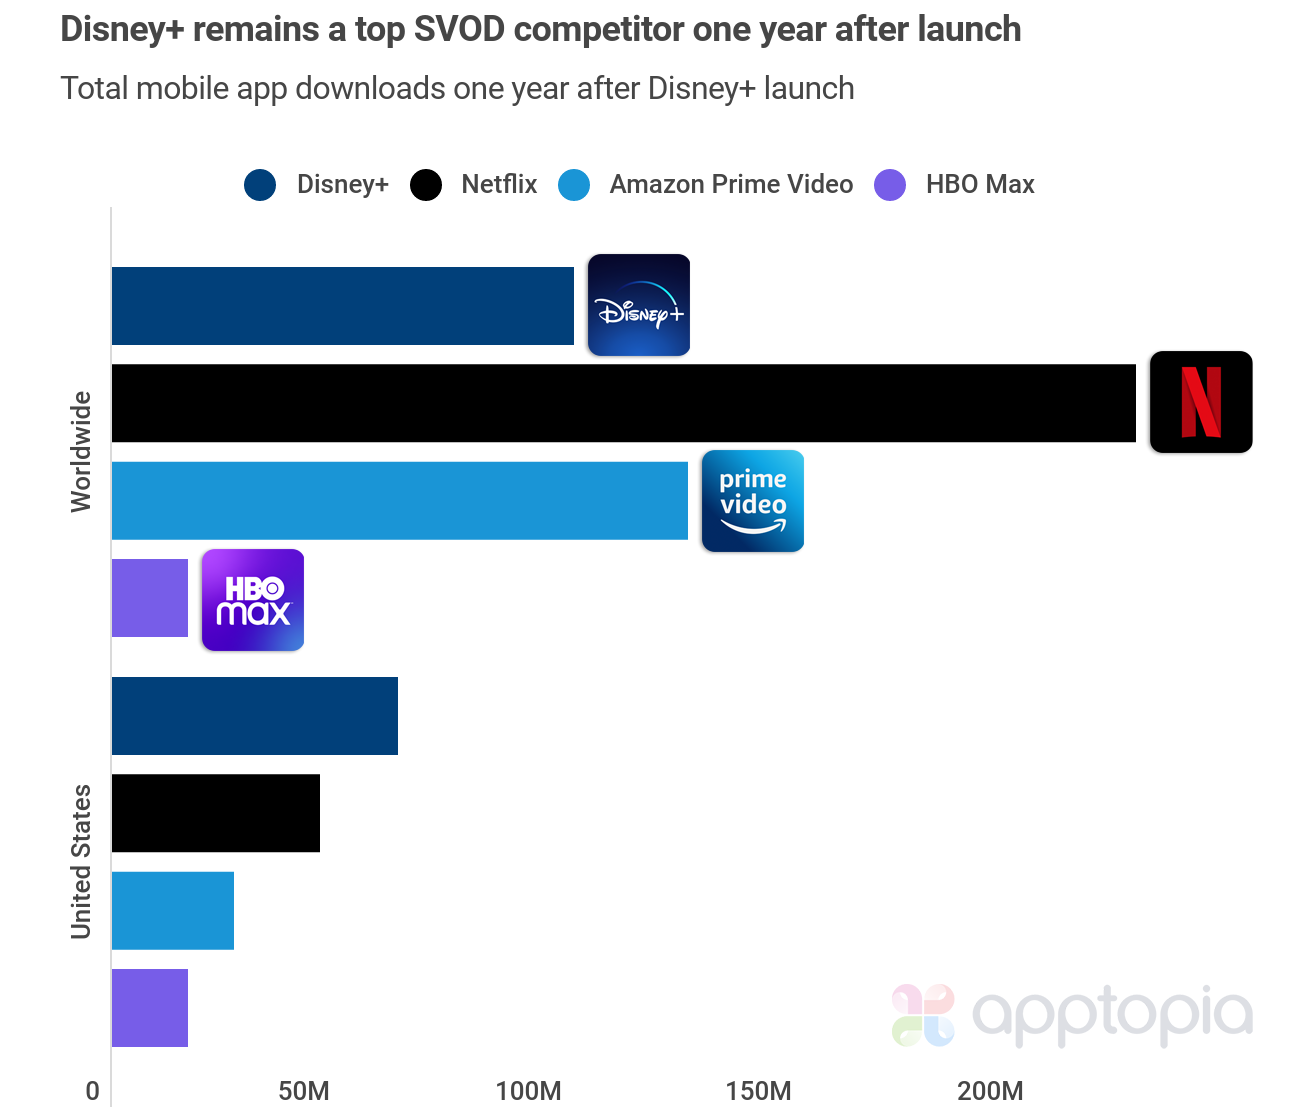
After one year of Disney+ being live on the app stores, Apptopia estimates it has been downloaded 100 million times globally, with 62% of those coming from the US and 38% from international markets. Global numbers do not include India, where Disney+ is built into the Hotstar app. You may remember from an earlier report, we estimated that after just one month, Disney+ had 22 million global downloads with 85% of them coming from the US.

This is the highest number of downloads in the first year of launch for any streaming video platform but that is not necessarily impressive when you consider its biggest competitor (Netflix) launched on the app stores in a very different time where the total addressable market was significantly lower.
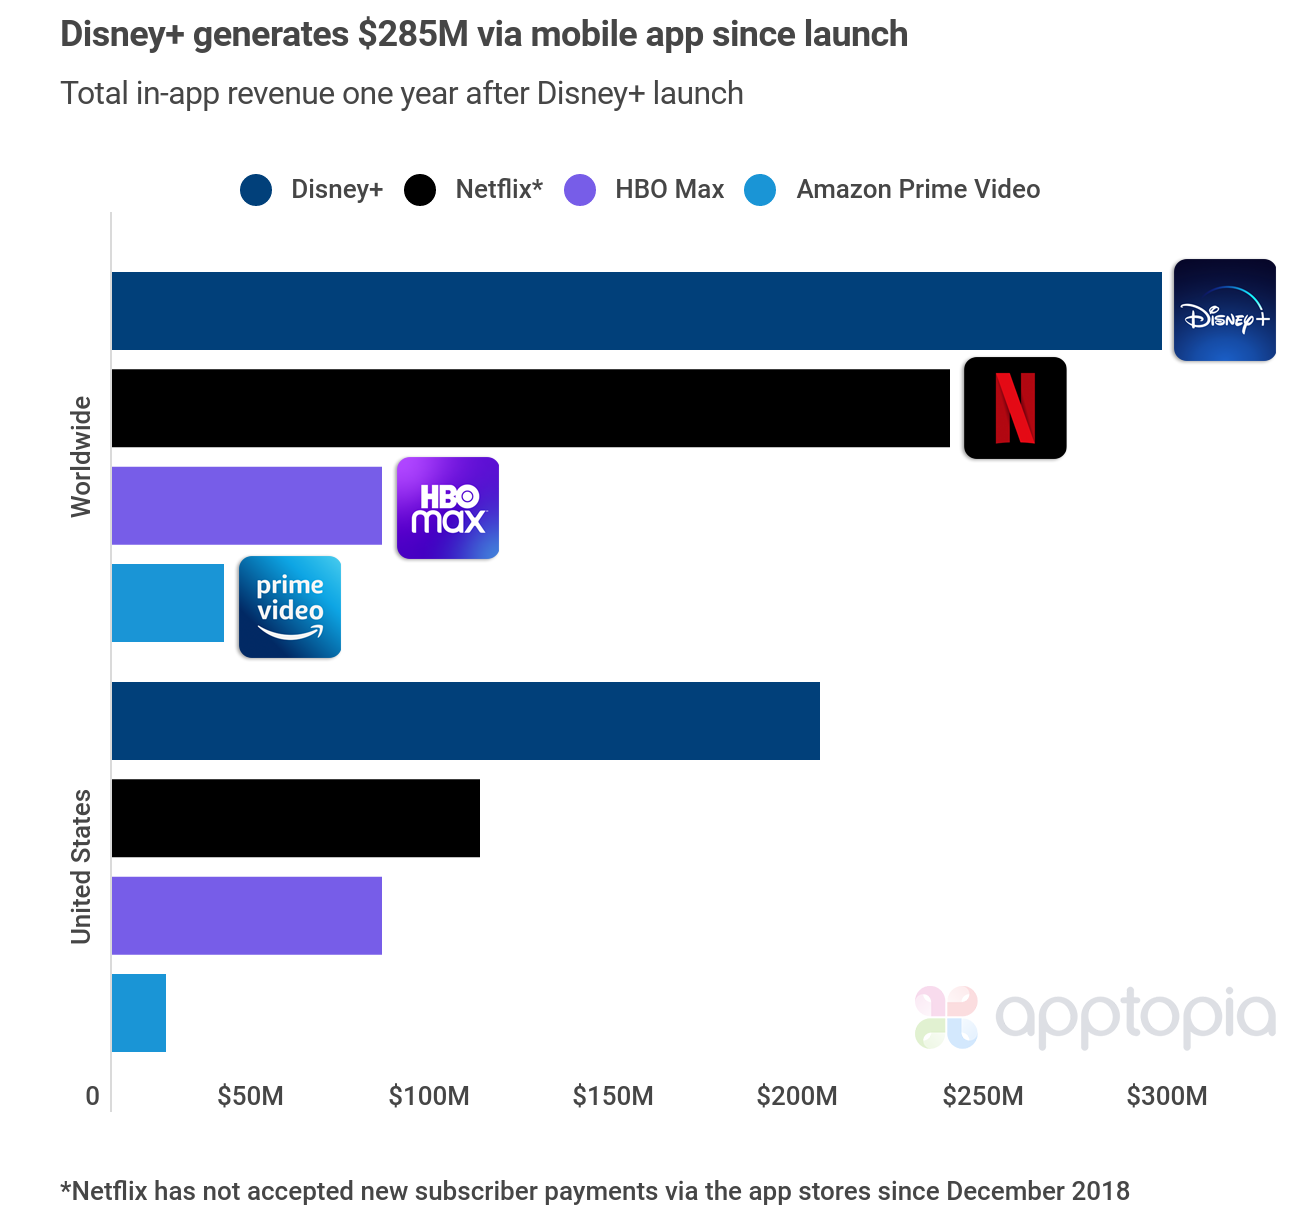
Mobile in-app purchase (IAP) revenue for Disney+ after one year stands at $285 million globally, with 67% coming from the US and 33% from international markets. Apptopia estimated IAP revenue is what the publisher takes home, meaning it is after the app store fees from Google and Apple have been levied.

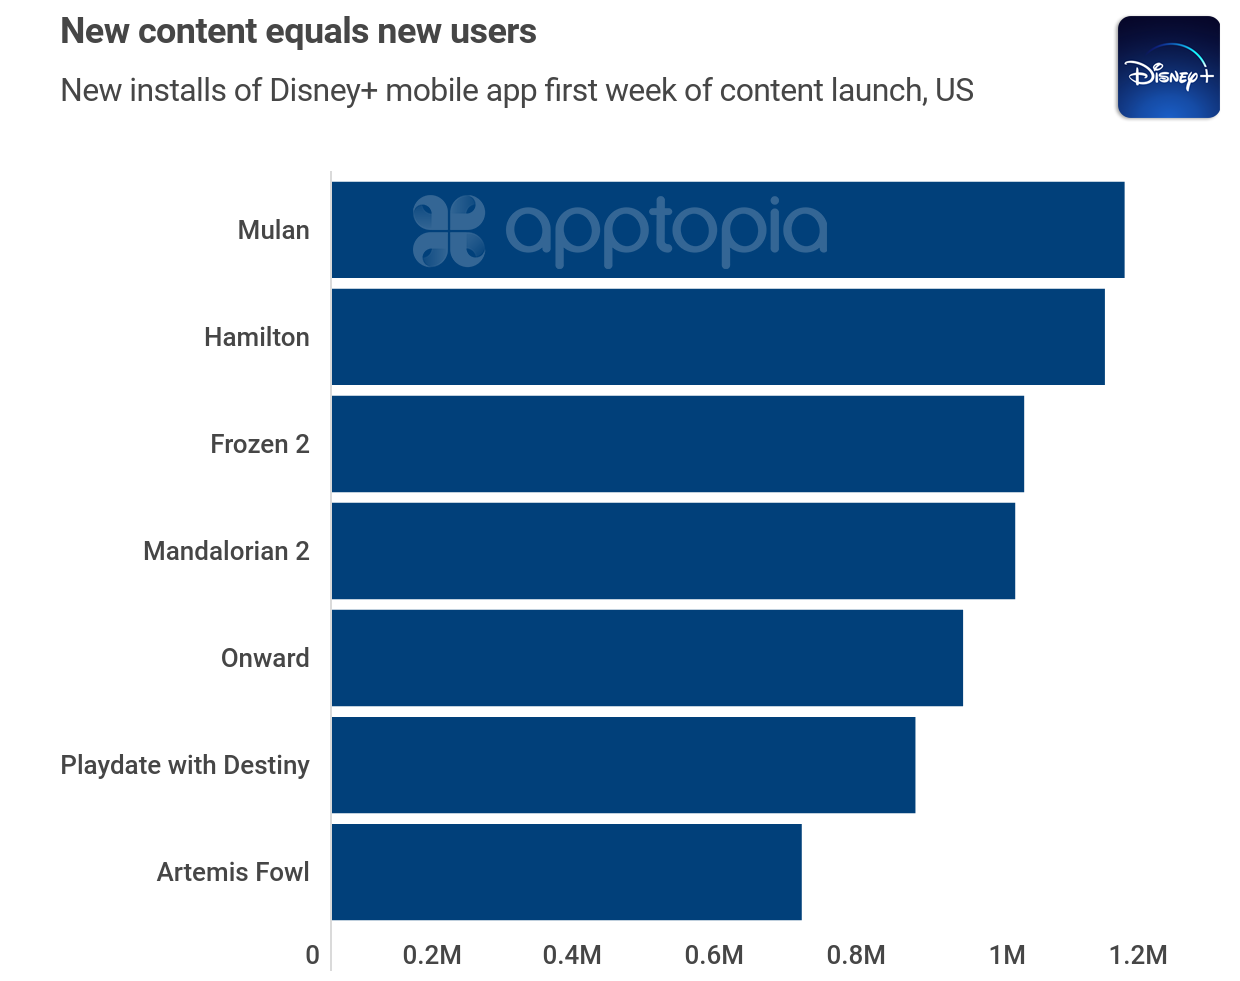
Disney+ relies heavily on new content. As we can see below, people definitely download and watch when a heavily marketed and anticipated show or movie comes to the service. The problem for Disney is that there is either not enough content, or not a wide enough array of content to keep users coming back into the app.

In our one month report linked to above, we included a graphic displaying Disney+'s user retention as being a potential problem. It started out above industry average but fall below by Day 30. The below image is showing October 2020 U.S. user retention data and we can see that Disney+ is still starting hot by having the highest Day 1 percentages compared to its competitors, but eventually falling fast to be last in the Day 30 percentages. For Apptopia user retention data, Day 0 is day of download.

While Netflix is still the golden child in consumers’ eyes, Disney+ is gaining ground with positive user reviews. Both images below are of volume of reviews vs. user review sentiment, but the first one is displaying the data over the past 365 days while the second is showing it just over the past 30.


To learn more about the data behind this article and what Apptopia has to offer, please reach out to Connor Emmel at cemmel@apptopia.com.


Sign up to receive our stories in your inbox.
Data is changing the speed of business. Investors, Corporations, and Governments are buying new, differentiated data to gain visibility make better decisions. Don't fall behind. Let us help.


Sign up to receive our stories in your inbox.
Data is changing the speed of business. Investors, Corporations, and Governments are buying new, differentiated data to gain visibility make better decisions. Don't fall behind. Let us help.


