Recent loan performance data from CoreLogic shows that the nation’s overall mortgage delinquency rate – the proportion of mortgage loans falling 30 or more days behind scheduled payment, including loans in foreclosure – have risen quickly during the COVID-19 pandemic, as millions of Americans lost their jobs and income due to the economic shutdown. As the job losses piled up – in April alone, more than 22 million of Americans filed unemployment claims, or 14.7% of the civilian labor force – many homeowners struggled to keep up with their mortgages: the overall mortgage delinquency rate rose from 3.6% in March to 6.1% in April and by May, to 7.3% – more than doubling from the pre-pandemic levels. Meanwhile, as low interest rates fueled strong housing demand, home prices continued to surge with the growth accelerating through the crisis. See Figure 1.
Figure 1: Home Price Growth and Mortgage Delinquency Rates during the COVID-19
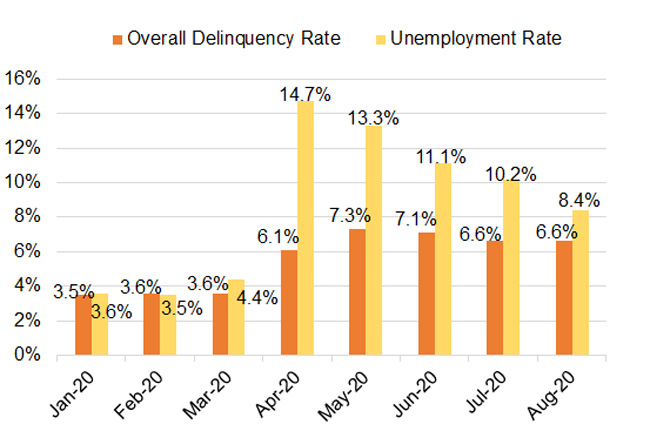
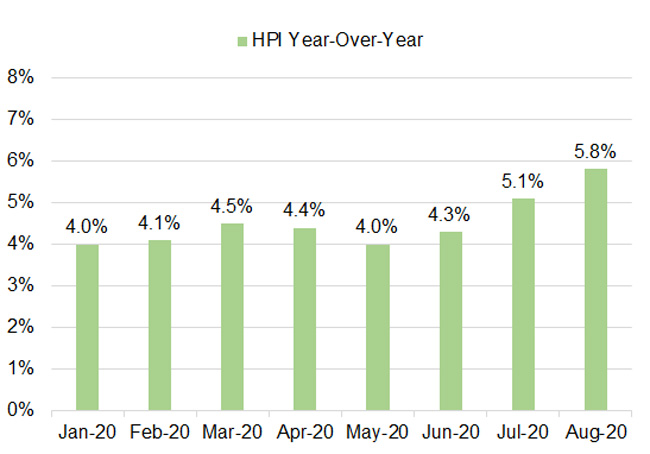
It may appear paradoxical that mortgage delinquencies and home prices have moved in the same direction.[1] It is true that mortgage defaults and home prices do typically go hand in hand, but just not in the same direction as we’ve seen in the current pandemic. And unlike the last mortgage crisis when home prices collapsed due largely to risky subprime and low/no-doc mortgages that fueled an unsustainable asset bubble bound to burst, the COVID-19 and the shocks it sent through the economy and housing market are entirely exogeneous – not to mention that at the onset of the pandemic, homeowner’s equity was at all-time highs. And thanks to the U.S. federal government’s swift response at the onset of the pandemic, the mandates from the CARES Act have allowed homeowners experiencing a job loss or pandemic-related financial hardships to defer and delay mortgage payment.
At the height of the pandemic, approximately 9.7% of the loans in servicing sought forbearance protection in April alone. But with many borrowers falling behind on their payment, mortgage delinquencies began to rise. In fact, if one takes a closer look at the pandemic delinquent loan pool, it becomes apparent that the majority are indeed loans under payment forbearance but have a missed payment.
While the delinquent loans in forbearance are treated as though they were current under the mandates of the CARES Act, any missed payment will nevertheless continue to result in a status update by servicers to indicate a loan’s de facto payment status each month. Consequently, as many borrowers in forbearance fall behind payment due to job losses or financial hardships, the loans become “technically delinquent” on servicers’ book and hence part of the tally going into reported mortgage delinquency measures.[2] As shown in Figure 2, loans in forbearance that have fallen behind payment make up the majority of the delinquent loan pools since April.
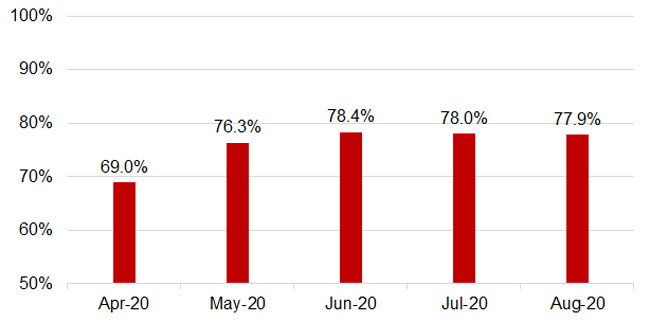
Figure 2: Loans in Forbearance in the Overall Delinquent Loan Pool
Source: CoreLogic Loan-Level Market Analytics. Only servicers who provided complete loan-level forbearance information from April through August were included in the analysis.
The share of loans in forbearance in the delinquent pools continues to rise through the pandemic. At the end of August, more than three out of four loans (77.9) in the delinquent pool are loans in forbearance and behind payment for 30 days or more. The remaining 22.1% consists of delinquent loans not in forbearance.
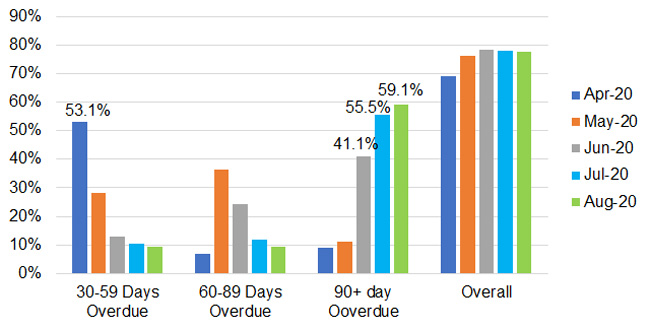
Next, a breakdown by the different stages of delinquency further confirms that April’s widely reported rise in the overall delinquency rate is driven by loans entering forbearance during April and subsequently falling behind payment. As shown in Figure 3, 53.1% of the delinquent loans are loans in forbearance entering early stage delinquency.
Figure 3: Loans in Forbearance by Stages of Delinquency
Source: CoreLogic Loan-Level Market Analytics. Only servicers who provided complete loan-level forbearance information from April through August were included in the analysis.
The breakdown also reveals that in the five months since the passage of the CARES Act, many forbearance loans have transitioned into late stages of delinquency: by July, loans in forbearance with payment 90+ day overdue have accounted for more than one half (55.5%) of the overall delinquent loan pool, up from about 41% in June. As of August, close to 60% of the loans in forbearance are 90 days or more past due.
New flows into forbearance have slowed significantly since the peak of the pandemic (Figure 4). In April, of the servicing loan pool used in the analysis– including federally-insured and GSE-backed loans covered by the CARES Act as well loans in private-label securities or loans with unidentifiable purchaser – approximately 9.7% entered forbearance. From May to August, fewer than 1-in-100 loans sought payment relief each month. At the end of August, loans in forbearance made up 8.3% of the overall loan pool.
Figure 4: Loans Entering Forbearance by Month
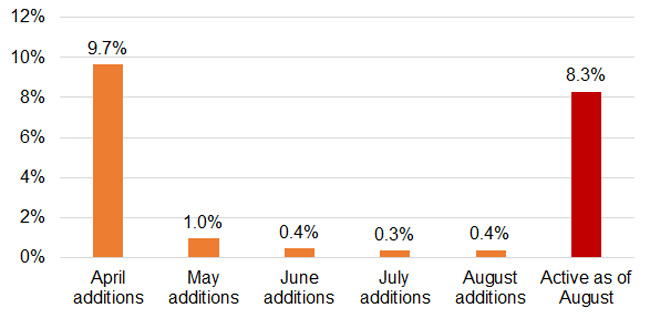
Source: CoreLogic Loan-Level Market Analytics. Only servicers who provided complete loan-level forbearance information from April through August were included in the analysis. The percentage calculation for each month’s forbearance flow is based on the active loan count of the previous month-end. The forbearance rate as of August is based on July-end active loan count.
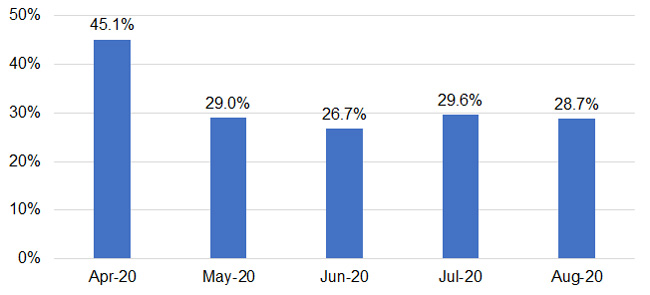
New flows into forbearance are likely to remain insignificant amid continued economic and job recoveries. However, mortgage delinquencies, especially late-stage delinquencies, are likely to stay elevated in the near term as the majority of the loans in the delinquent pool remaining in forbearance and behind payment. As of August, only about 30% of the loans in forbearance have managed to stay current (Figure 5), with the remaining 70% in various stages of delinquency.
Figure 5: Percentage of Loans in Forbearance That Were Current
Source: CoreLogic Loan-Level Market Analytics. Only servicers who provided loan-level forbearance information from April through August were included in the analysis.
As of August, about 29.4% of the loans that entered forbearance in April through August exited forbearance, up from 25.2% in July and 17.8% in June (Figure 6).
Figure 6: Percentage of Loans Exiting Forbearance
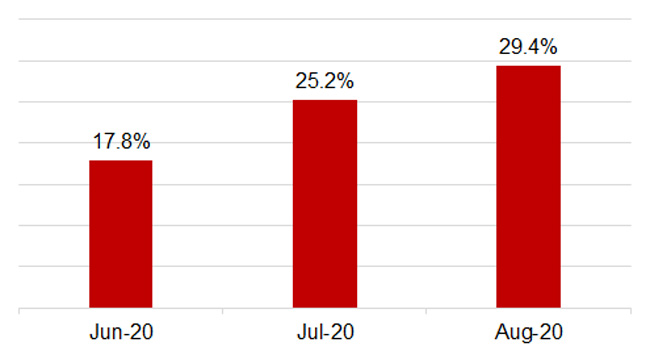
Source: CoreLogic Loan-Level Market Analytics. Only servicers who provided loan-level forbearance information from April through August were included in the analysis. Loan exits as of a given month are calculated as (1-loans in active forbearance as of a given month/total forbearance entries from April through the measurement month). May 2020 has a positive net inflow and is not shown.
With the economic recovery well underway – the latest Q3 GDP data shows the economy rebounded at an annualized rate of 33.1% from the previous quarter – exits from forbearance may continue to pick up in coming months as more Americans are back at work and able to resume payments. Also, with interest rates expected to remain at record lows, some of these borrowers may be able to refinance their existing mortgage into a lower rate while repaying any missed payments.
Data notes. The data used in the analysis represent slightly less than 80% (in loan count) of the servicing portfolio maintained by CoreLogic’s Loan-Level Market Analytics. In the analysis, loans in forbearance are identified based on a forbearance status of active or pending.
To learn more about the data behind this article and what CoreLogic has to offer, visit https://www.corelogic.com/.


Sign up to receive our stories in your inbox.
Data is changing the speed of business. Investors, Corporations, and Governments are buying new, differentiated data to gain visibility make better decisions. Don't fall behind. Let us help.


Sign up to receive our stories in your inbox.
Data is changing the speed of business. Investors, Corporations, and Governments are buying new, differentiated data to gain visibility make better decisions. Don't fall behind. Let us help.