We have refreshed our earlier look at holiday performance, now including the full 2020 holiday season.
Key Takeaways:
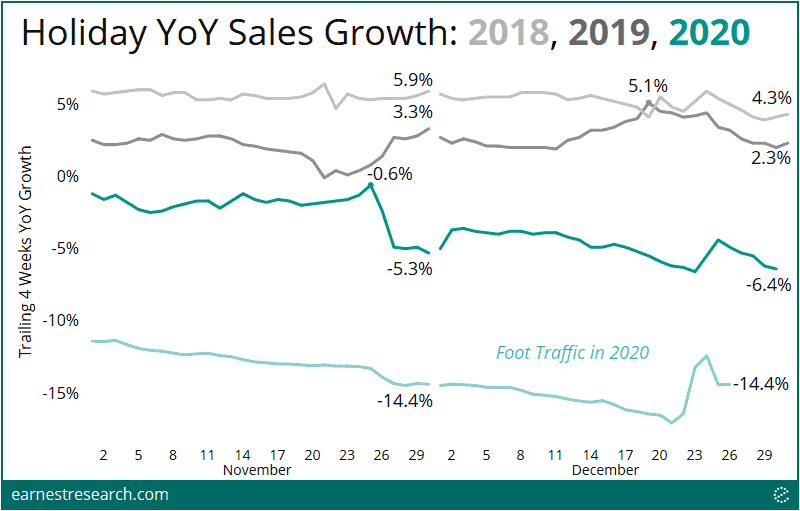
2020 Holiday Not Immune
Aggregate consumer spending for the months of November and December declined ~5 and 6% YoY respectively, driven by foot traffic declines of ~14%, a drastic slowdown relative to the ~2% to 6% YoY sales growth exhibited in the same period in the last two years. Most of November this year saw a ~1% decline until the Thanksgiving commence to the season, which, due to 2019’s compressed season early rush, sent YoY declines down 5%—a rate that never really rebounded throughout the rest of this pandemic-defined holiday.
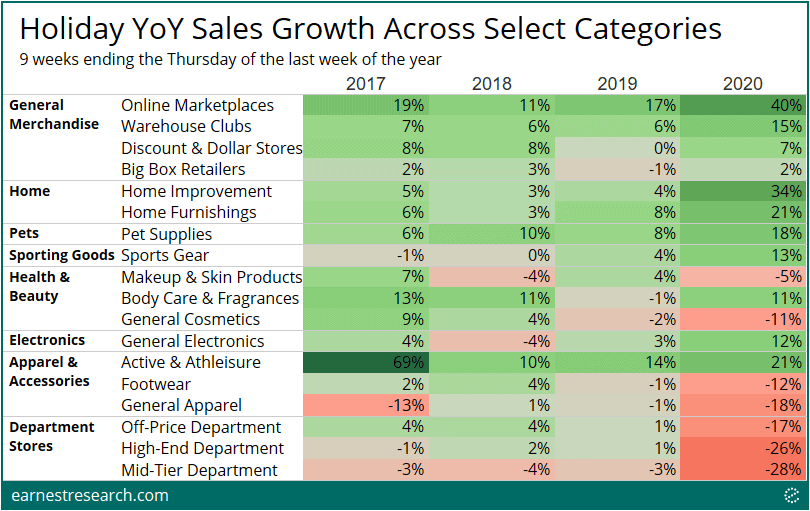
COVID = Online, Home, and Pets
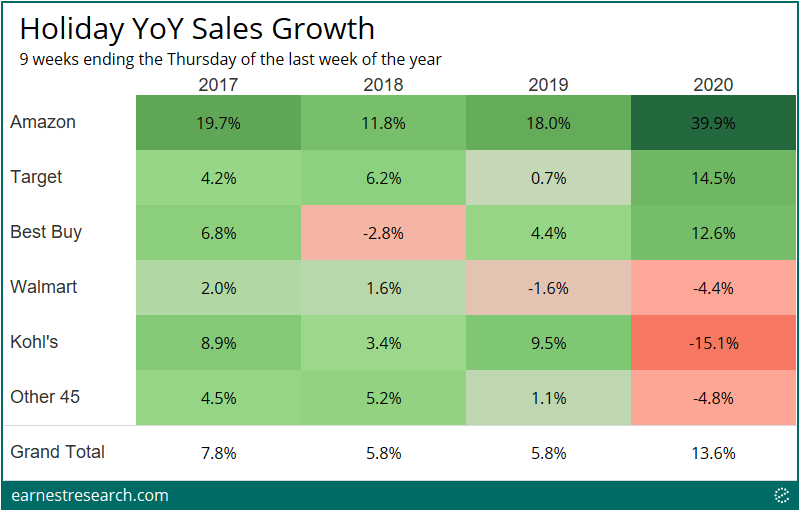
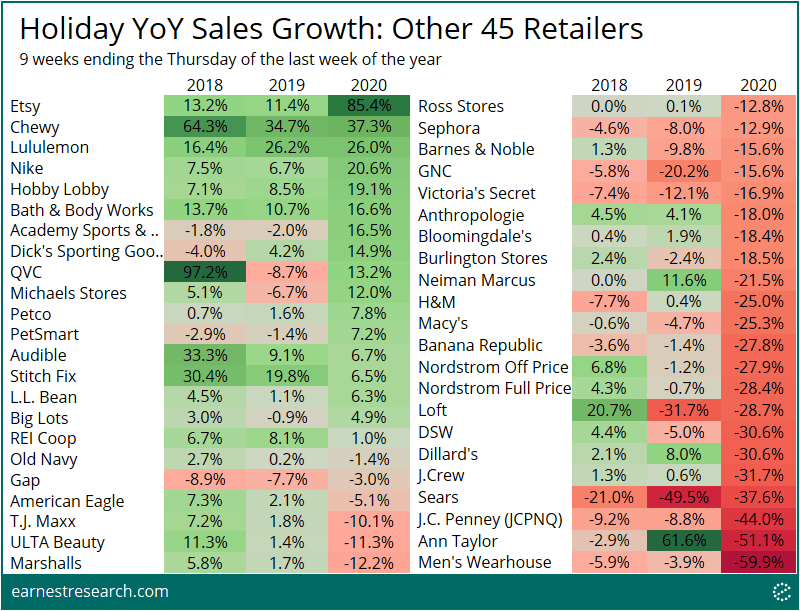
Target and Best Buy Escape
Looking at performance** across the largest traditionally holiday-oriented retailers, it was indeed an unusual year with a handful of retailers seeing double-digit growth alongside a majority that saw double-digit declines.
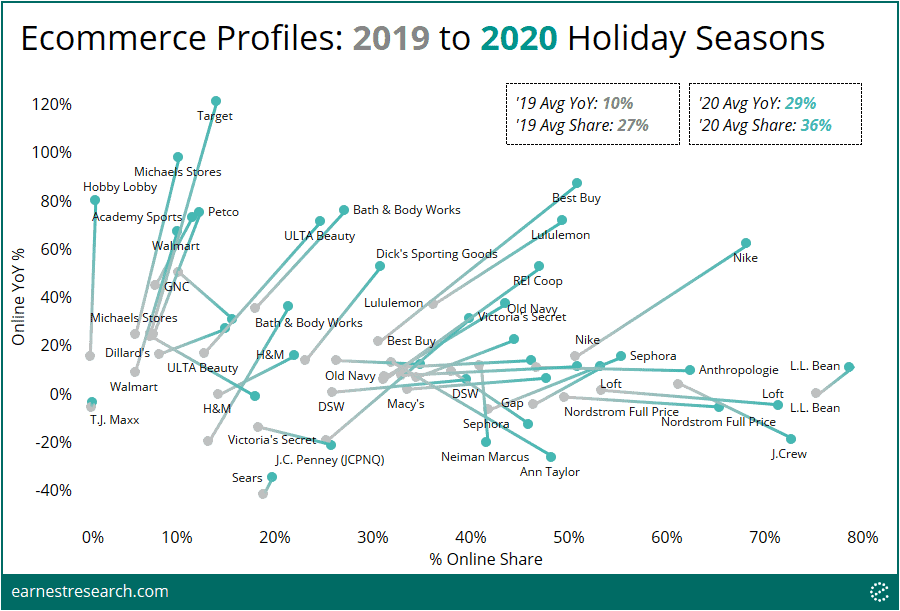
The Ecommerce Transformation
In order to appreciate the shift to online this season, we looked at each retailer’s online YoY performance and plotted it alongside its percent share of total sales for both the 2020 and 2019 holiday seasons.
Overall, during the 2019 holiday season, the average online growth was 10% YoY and the average online share was 27% across a basket of 40 large retailers. 2020’s ecommerce transformation resulted in these metrics increasing to an average growth of 29% YoY and an average share of 36%.
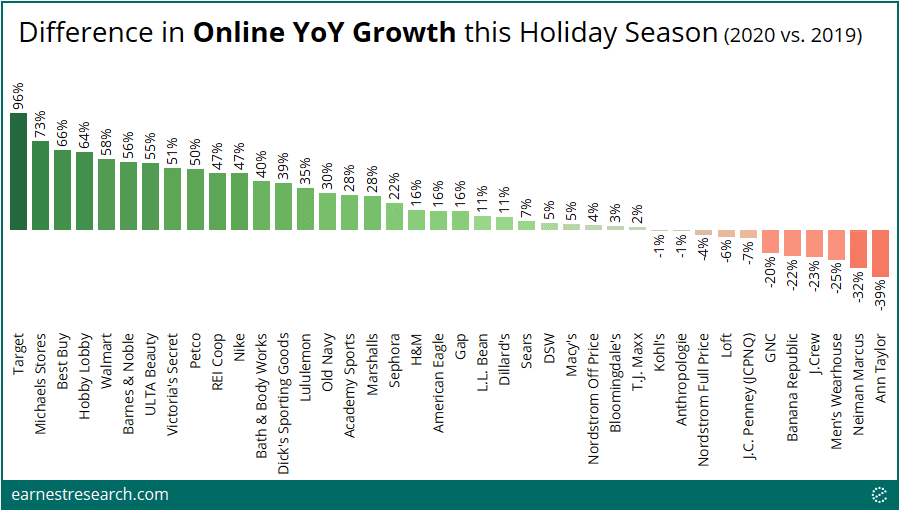
Some of the largest increases in YoY online growth included Target (+96pts), Michaels (+73pts), Best Buy (+66pts), Hobby Lobby (+64pts), and Walmart (+58pts); the least were Ann Taylor (-39pts), Neiman Marcus (-32pts), Men’s Wearhouse (-25pts), J.Crew (-23pts), and Banana Republic (-22pts).
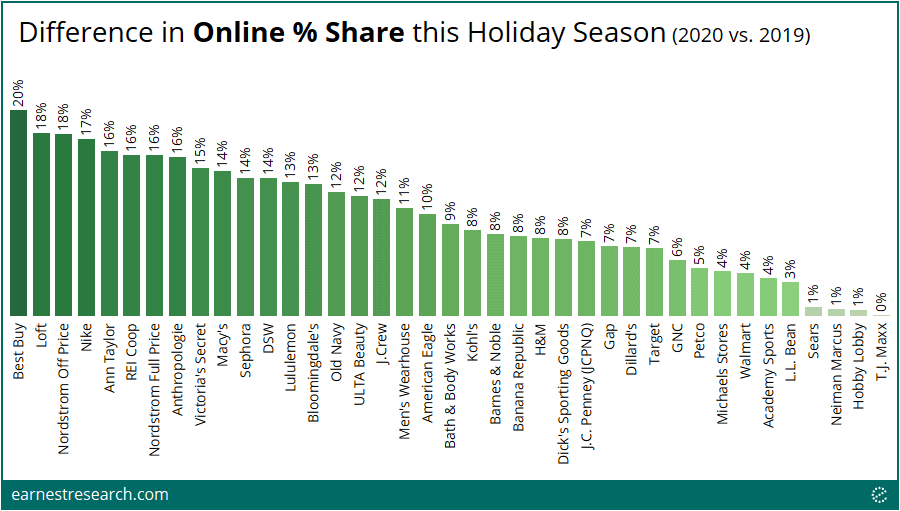
Some of the largest increases in online share included Best Buy (+20pts), Loft (+18pts), Nordstrom (+18pts), Nike (+17pts), and Ann Taylor (+16pts). T.J.Maxx, Hobby Lobby, Neiman Marcus, and Sears all saw virtually zero change in share.
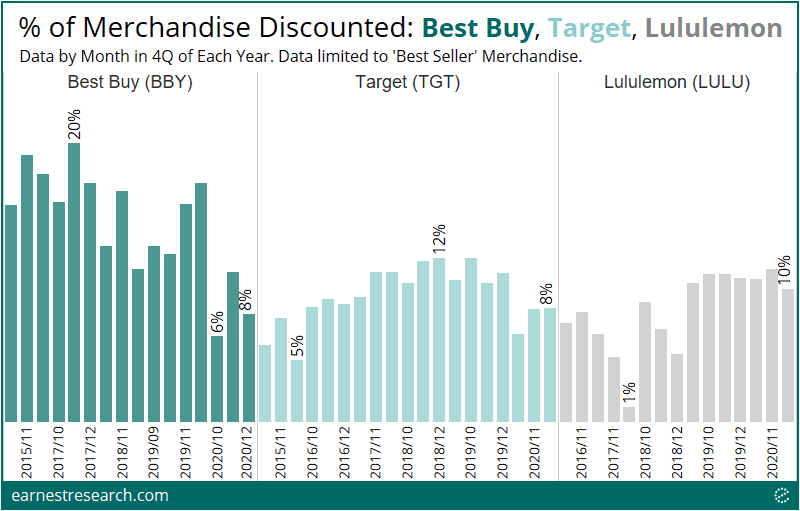
A Not So Promotional Holiday
In this rapidly changing, online-centric competitive landscape, we utilized our newest Retail Pricing data to uncover trends beyond top line sales for some of the winners of the 2020 holiday season like Best Buy and Target. Specifically, we investigated if retailers resorted to more promotions to drive sales or if, on the contrary, their market domination granted them more pricing power.
The answer was unequivocal – both Best Buy and Target had exceptionally low levels of promotional activity over this 2020 Holiday season. Total % Merchandise Value Discounted – measuring the overall level of discounting across the merchandise (including both full-price items and on-sale items), was 6-11% and 6-8% for best-selling products at Best Buy and Target between Oct-Dec 2020, representing 6-year and 5-year lows, respectively.
We analyzed the trends for Lululemon, another strong performer of the 2020 holiday season. As depicted above, the fitness retailer saw flat YoY trends in top-line growth (~26% both in 2019 and 2020), and interestingly saw flat YoY trends in Total % Merchandise Value Discounted as well, at ~10-11% both in 2019 and 2020.
Most Exposed for Stim^2
Lastly, utilizing our income data, and considering the 2nd round of stimulus checks just beginning to roll out, we looked at which retailers’ holiday sales were most exposed to the <$100K income bracket—and, in effect, more sensitive to another round of stimulus funds. Below depicts the list of ~50 retailers in descending order of most exposed to least exposed share of holiday sales by the <$100K income bracket.
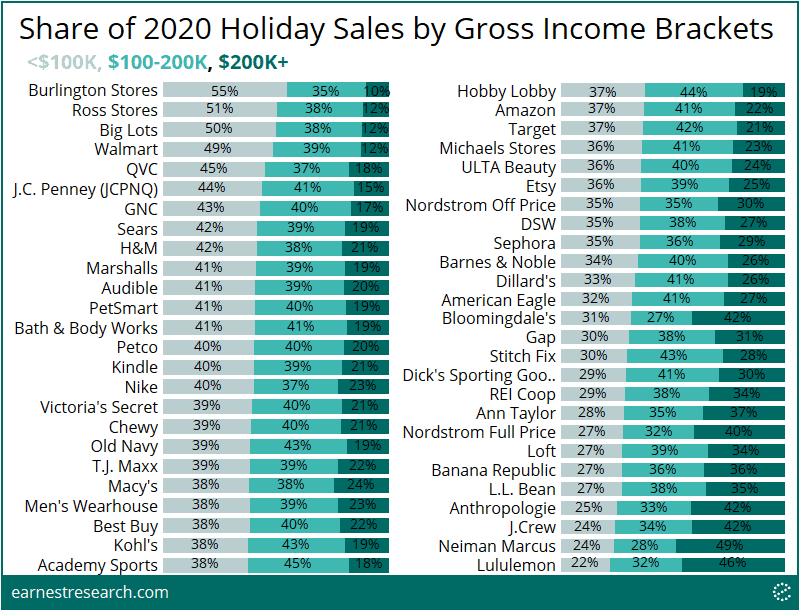
*excludes ~12 to 18% of sales from income brackets that are unavailable.
Notes
Analysis excludes spend made on store-branded cards that will likely not be paid down until after the holiday period. Many retailers in this analysis are sensitive to this exclusion.
*We define the full holiday season as 64 days (9 weeks) ending the Thursday of the last week of the year.
**Based on the most recent backtest results, Amazon growth is likely overstated in the data, Walmart and Target are likely understated, and Kohl’s was overstated last year. In general, all merchant performance trends should be interpreted in the context of our EarnestKPI backtest differentials. For a better understanding of our biases and differentials, schedule a demo.
To learn more about the data behind this article and what Earnest Research has to offer, visit https://www.earnestresearch.com/.


Sign up to receive our stories in your inbox.
Data is changing the speed of business. Investors, Corporations, and Governments are buying new, differentiated data to gain visibility make better decisions. Don't fall behind. Let us help.


Sign up to receive our stories in your inbox.
Data is changing the speed of business. Investors, Corporations, and Governments are buying new, differentiated data to gain visibility make better decisions. Don't fall behind. Let us help.