
Home Price Index Highlights: December 2020
National home prices increased 9.2% year over year in December 2020, according to the latest CoreLogic Home Price Index (HPI®) Report. The December 2020 HPI gain was up from the December 2019 gain of 4% and was the highest year-over-year gain since February 2014. Price appreciation averaged 5.7% for full year 2020, up from the 2019 full year average of 3.8%. Home price growth in 2020 started off at a modest 4.3% rate in the first quarter, but as the pandemic limited supply throughout 2020, home price growth picked up, ending the year with an increase of 8.3% for the fourth quarter. While home price growth is expected to slow during 2021, it will remain high in the first half of the year and average growth for this year is expected to climb to 6.9%.
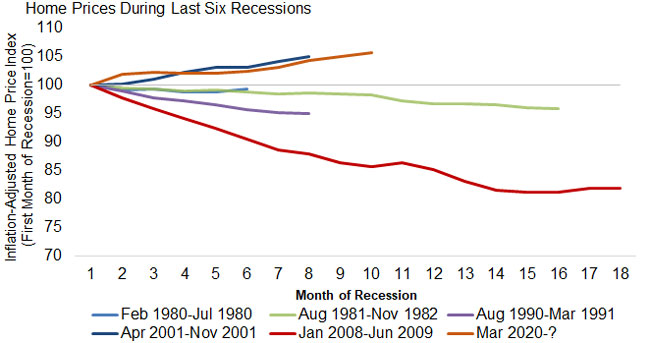
The recession that started in March 2020 did not slow home price growth. Figure 1 shows movements in the inflation-adjusted HPI[1] for the six most recent recessions starting from the first month and through the end of each recession. Numbers below 100 indicate falling home prices, which has been a feature of four of the six recessions. However, at ten months in, the 2020 recession is following the path of the 2001 recession, which is the only other one of the six with increasing home prices. The worst of the six recessions was the Great Recession that started in 2008, which was characterized by excess supply of homes for sale, which is not the case in today’s tight-supply housing market.
Figure 1: Home Prices Typically Fall During Recessions, But Prices Up in 2020
CoreLogic analyzes four individual home-price tiers that are calculated relative to the median national home sale price[2]. Home price growth accelerated for all four price tiers in 2020 to the highest rates since 2013 for the two middle-price tiers and since 2006 for the high- and low-price tiers. The lowest price tier increased 13% year over year in December 2020, compared with 11% for the low- to middle-price tier, 10.4% for the middle- to moderate-price tier, and 9.5% for the high-price tier.
Figure 2: Home Prices Accelerate at All Price Levels
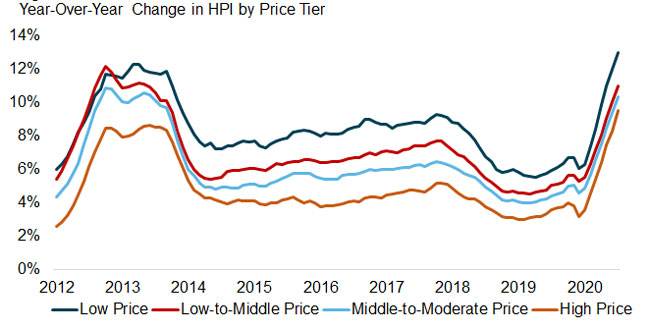
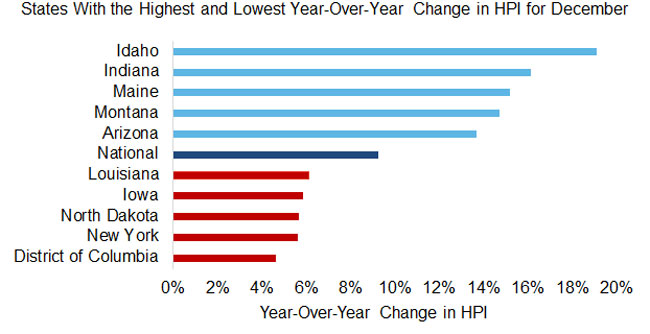
Figure 3 shows the year-over-year HPI growth in December 2020 for the 5 highest- and lowest-appreciating states. All states showed annual increases in HPI in December, and Idaho led the states in appreciation with appreciation of 19.1%. At the low end, Washington, D.C. saw an increase in home prices of 4.6%. The surge in home price appreciation was felt across the country, with all states showing higher appreciation in December 2020 than in December 2019. Indiana, Montana and Connecticut had the biggest acceleration in home price growth from December 2019 to December 2020. Connecticut is notable because price growth for this state was near zero in December 2019 but increased to 10.5% in December 2020. This turnaround can be partly attributed to an influx of buyers from metropolitan areas in nearby states.
Figure 3: All States Showed Annual Increases in HPI in December
[1] The Consumer Price Index (CPI) Less Shelter was used to create the inflation-adjusted HPI. It is important to adjust the HPI for inflation to compare recessions, especially since two of the recessions occurred during very high inflation periods.
[2] The four price tiers are based on the median sale price and are as follows: homes priced at 75% or less of the median (low price), homes priced between 75% and 100% of the median (low-to-middle price), homes priced between 100% and 125% of the median (middle-to-moderate price) and homes priced greater than 125% of the median (high price).
To learn more about the data behind this article and what CoreLogic has to offer, visit https://www.corelogic.com/.


Sign up to receive our stories in your inbox.
Data is changing the speed of business. Investors, Corporations, and Governments are buying new, differentiated data to gain visibility make better decisions. Don't fall behind. Let us help.


Sign up to receive our stories in your inbox.
Data is changing the speed of business. Investors, Corporations, and Governments are buying new, differentiated data to gain visibility make better decisions. Don't fall behind. Let us help.