January is well-known to be the biggest month for health and fitness app activity, so let’s take the data out for a spin and see what we can determine. We’ll start high level and then drill down into the performance of several Health & Fitness subcategories for the United States.
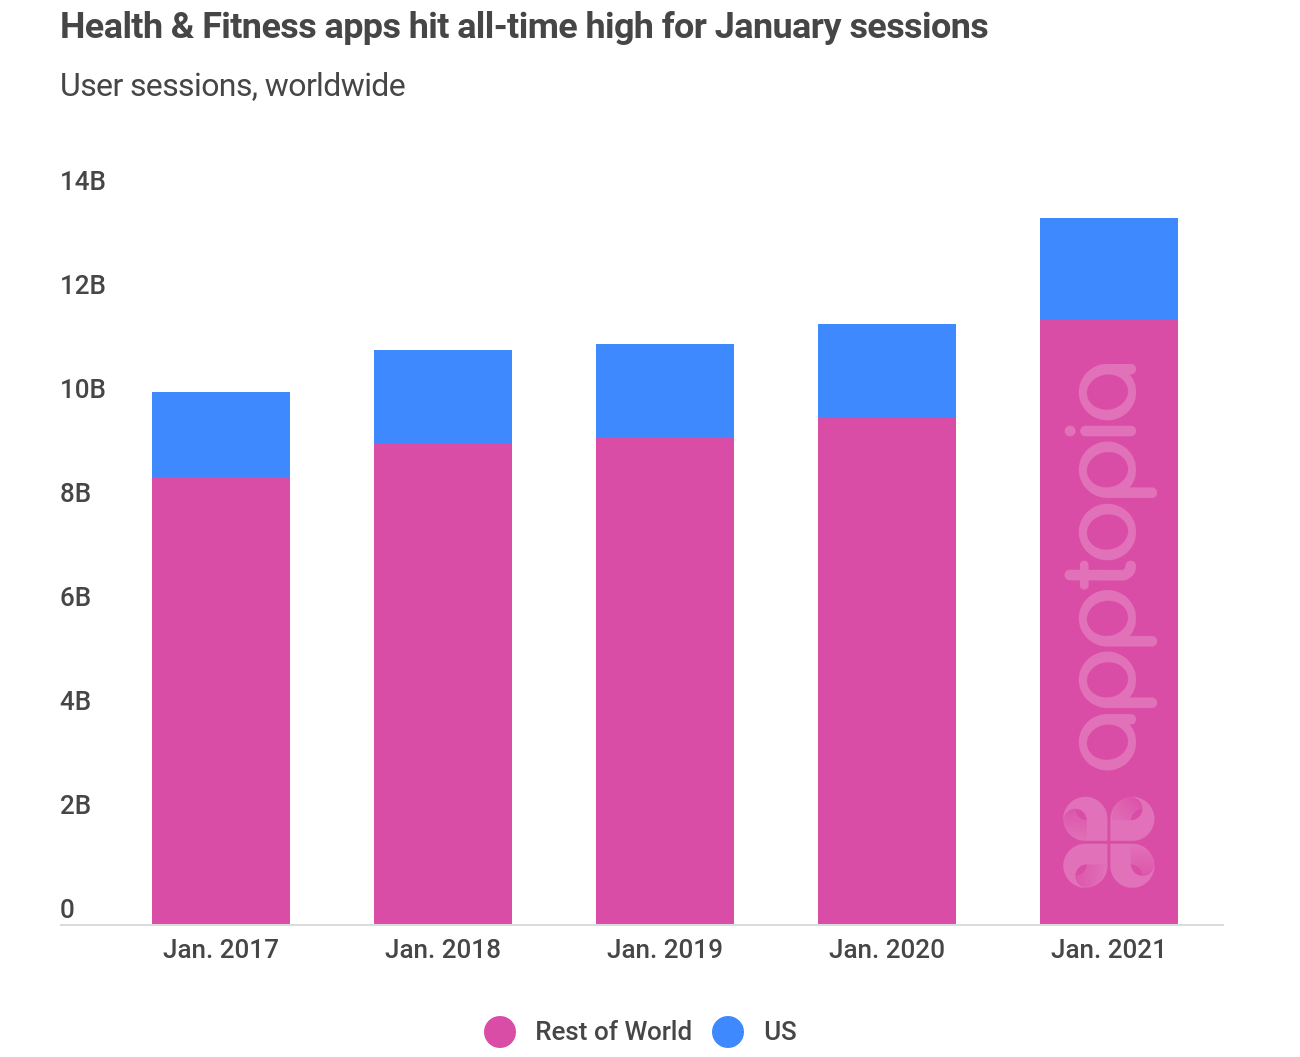
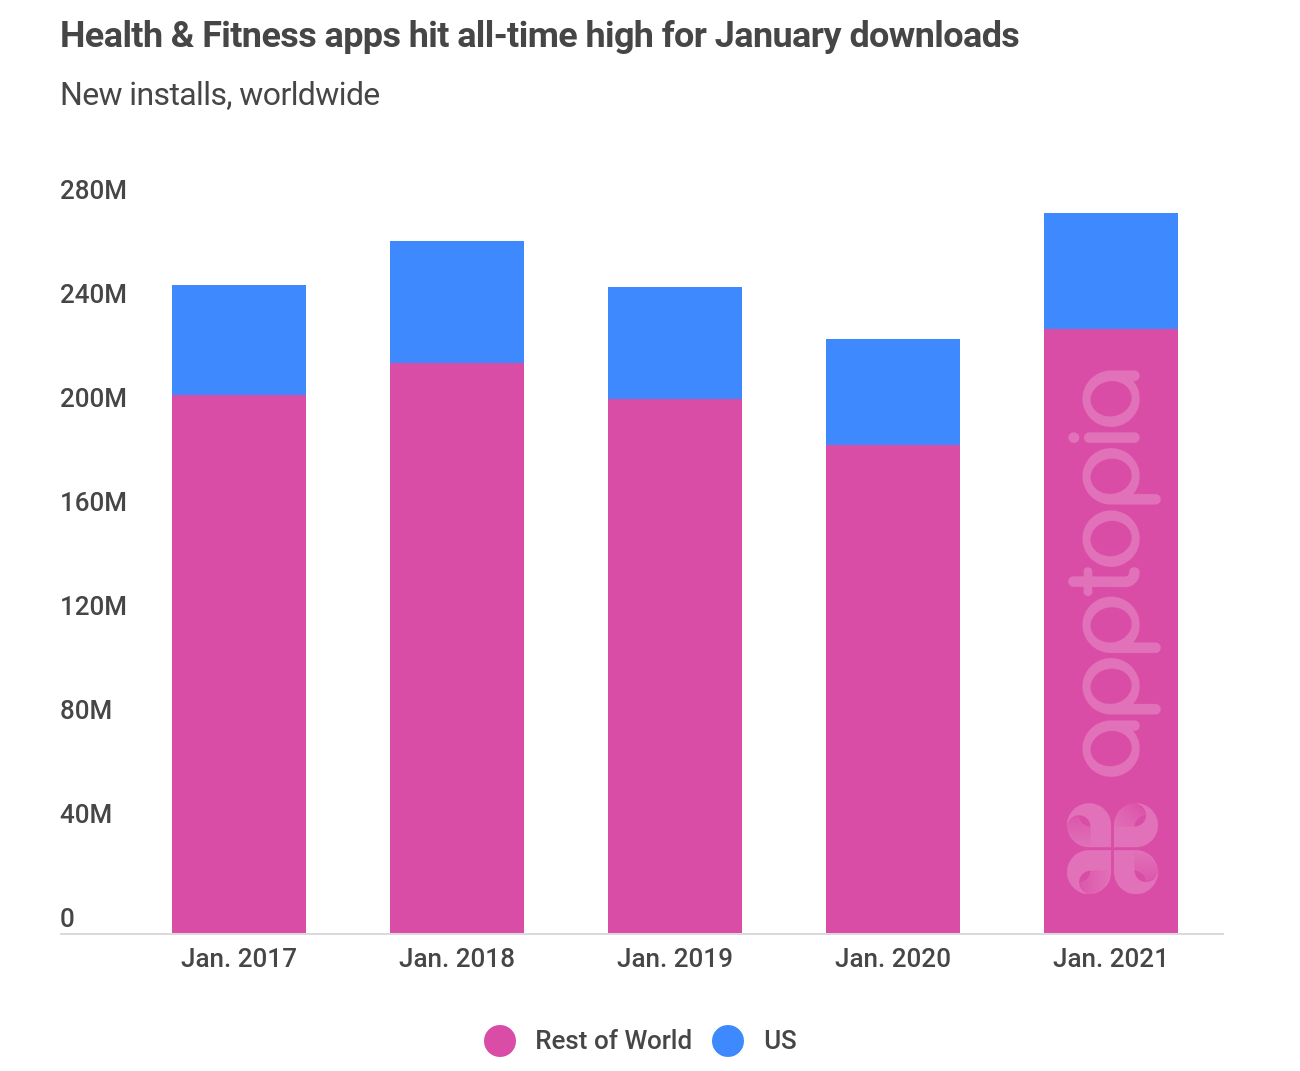
User Sessions of Health & Fitness apps grew 17.5% year-over-year (YoY). Last month also saw new installs hit a high water mark with 277 million, an increase of 21% YoY.
Three of the top five countries for fastest growing downloads are from the MENA region. I’m not an expert in the region so I’d love for a reader to let me know if there are any reasons for the strong growth. Speaking of readers, I asked everyone on Twitter and LinkedIn if you had any ideas of what I should include in this post and received lots of good feedback. I was able to speak to some of your requests but not all.
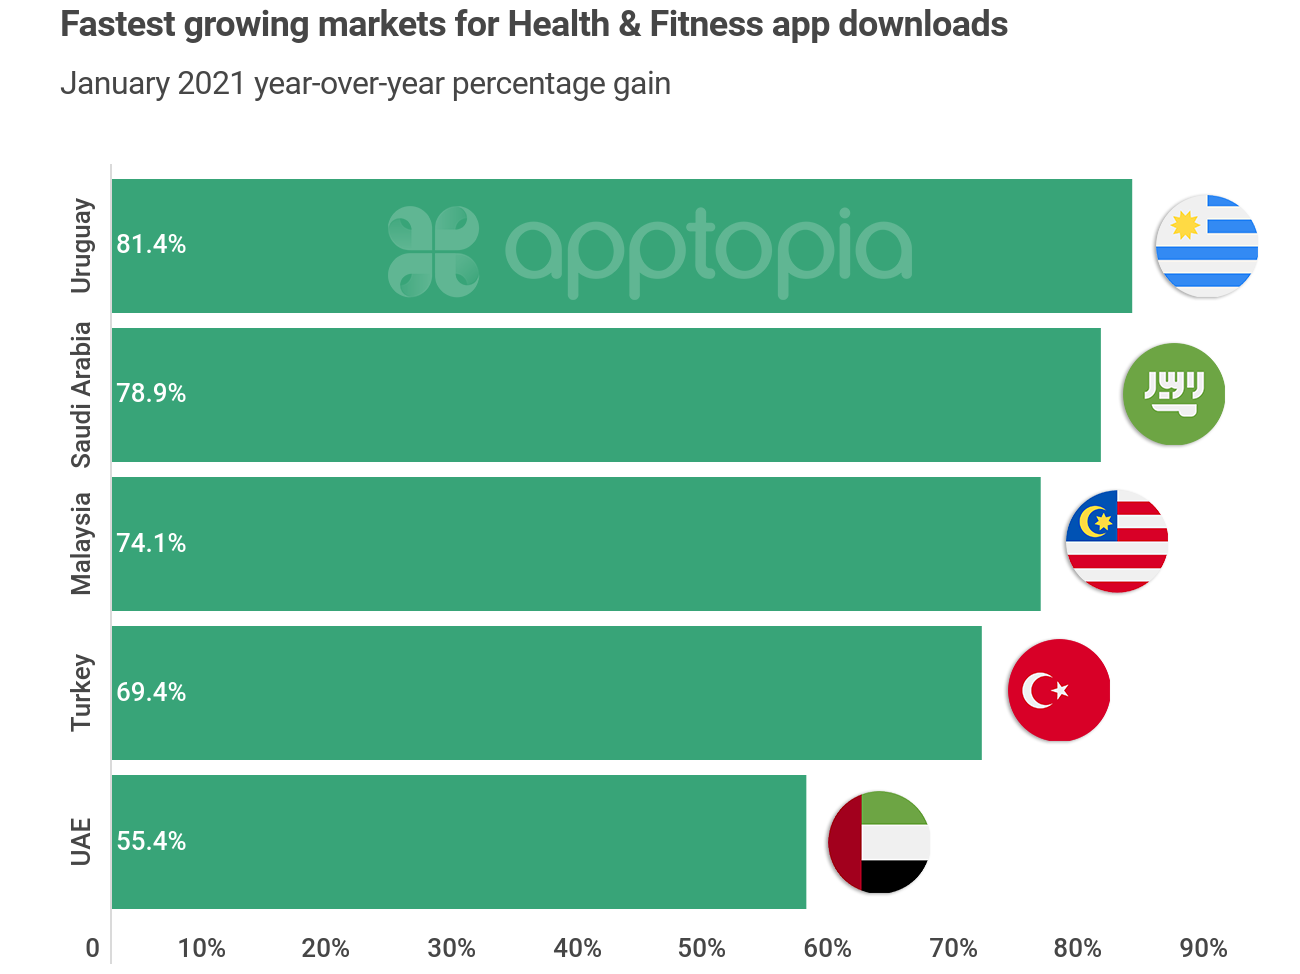
The immediate thing that stands out to me when comparing the above and below images is that none of the fastest growing countries for downloads made the list of fastest growing countries for revenue. It’s quite possible the apps people were downloading in those countries do not monetize via IAPs, or that because of free trials, we won’t see the revenue hit until February or March.
It also goes to show that downloads represent opportunity but are not a clear path to revenue in and of themselves (unless of course the app requires payment for download). Like any great digital business, you need to be attracting the right people and then they need to be nurtured the right way. You’re reading this blog, but I can’t reasonably expect you to purchase a subscription to Apptopia just because of it. We’re hoping you sign up for the newsletter, download a free report or create a custom free report. If you continue to like what you see, hopefully you request a demo.

Even though Venezuela is the fastest growing, its absolute numbers are still quite low compared to many other countries.
7UP
I dove into seven subcategories (custom defined by me) that we’ll talk about in varying degrees of detail below. This is meant to be a high level look at these subcategories. We’ll pick one or two of them to go deeper into in March for the purpose of analyzing how they maintained momentum (or tried to) from all of these January downloads.
Yes, there are many different ways these apps can be sliced and diced. I picked apps for each category by what I think makes the most sense, mainly by primary function. I know most apps can have arguments made for them to be in multiple subcategories. There are a few subcategories I am knowingly not including. These include yoga apps, sleep aid apps, ovulation apps, and walking/pedometer apps. Some apps studied will surely have components of the aforementioned but it is not their main focus. All data below is for the U.S. only.
GYM APPS
Apps of brick-and-mortar gyms are down in performance but you already knew that. What you might not have known is that Planet Fitness performed incredibly well, and was the second most downloaded (1.24M) Health & Fitness app in January that I studied. In March 2020, Planet Fitness began offering virtual workout classes online via their Facebook page and other channels. In April, they took it one step further by offering video workouts directly on their mobile app. In general, we found consumers prefer health and fitness apps with video workouts. This helped blur the lines of the app, transforming it from a “gym app” into something more closely resembling a “workout app.”
DEVICE-CONNECTED FITNESS APPS
There are people who scrolled to this section just to get some info on Peloton, and that’s exactly what this category is about, apps that are created specifically for a piece of hardware the publisher makes, even if the app also serves purposes outside of the hardware. Top device-connected fitness apps as a whole saw new installs shrink 10.4% YoY. Peloton itself saw downloads decrease 25% YoY. The fastest growing app by downloads was Echelon Fit (direct competitor to Peloton) at 429% YoY.
Fitbit brought in the most in-app purchase (IAP) revenue this January with $1.6M (+82.2% YoY), followed by Peloton with $942k (+234% YoY). The app with the fastest growing revenue was iFit at 250% YoY.
Fitbit Premium is a monthly subscription that costs $9.99 a month but has the option to pay $79.99 annually. Peloton monetizes with a monthly subscription of $12.99 where users get access to on-demand fitness classes and do not need the hardware to use most of them. iFit has a very similar subscription priced $14.99 per month for, with the option to buy annually at $179.99. Unlike Peloton, iFit is purely the software that many hardware companies, such as NordicTrack, partner with to provide workout classes on.
*Personal anecdote* - There are definitely some mix and match plays to be had here for consumers. What I am about to describe may sound confusing but it’s simple in practice. I purchased an inexpensive Echelon bike (love it) but the bike does not have a screen on it. It does have a place for a tablet. I put my tablet on it where I am using the Peloton app instead of the Echelon app as a paying subscriber. To get the metrics from the Echelon bike, I launch the Echelon app on my phone and place it right beneath the tablet. Peloton’s resistance metric does not line up directly with Echelon’s but you can find a converter online. I printed that out and put it on the bike. This is how I, and others, are using Peloton’s great cycling workout classes without having to spring for the pricey hardware.

For our retention metric, Day 0 is download day. If users are opening the app 30 days after download day, they are counted in our 30th day user retention metrics. 30th day retention numbers in January refer to any user who hit their 30th day for the app within the month of January.
Garmin Connect and Fitbit did very well from a user retention standpoint in January. The physical component for both apps is essentially a wristwatch. I think devices you wear daily stay on your mind, leading to increased app retention. The H&F category average is up just slightly from January 2020, when it was 7.63%.
FASTING APPS
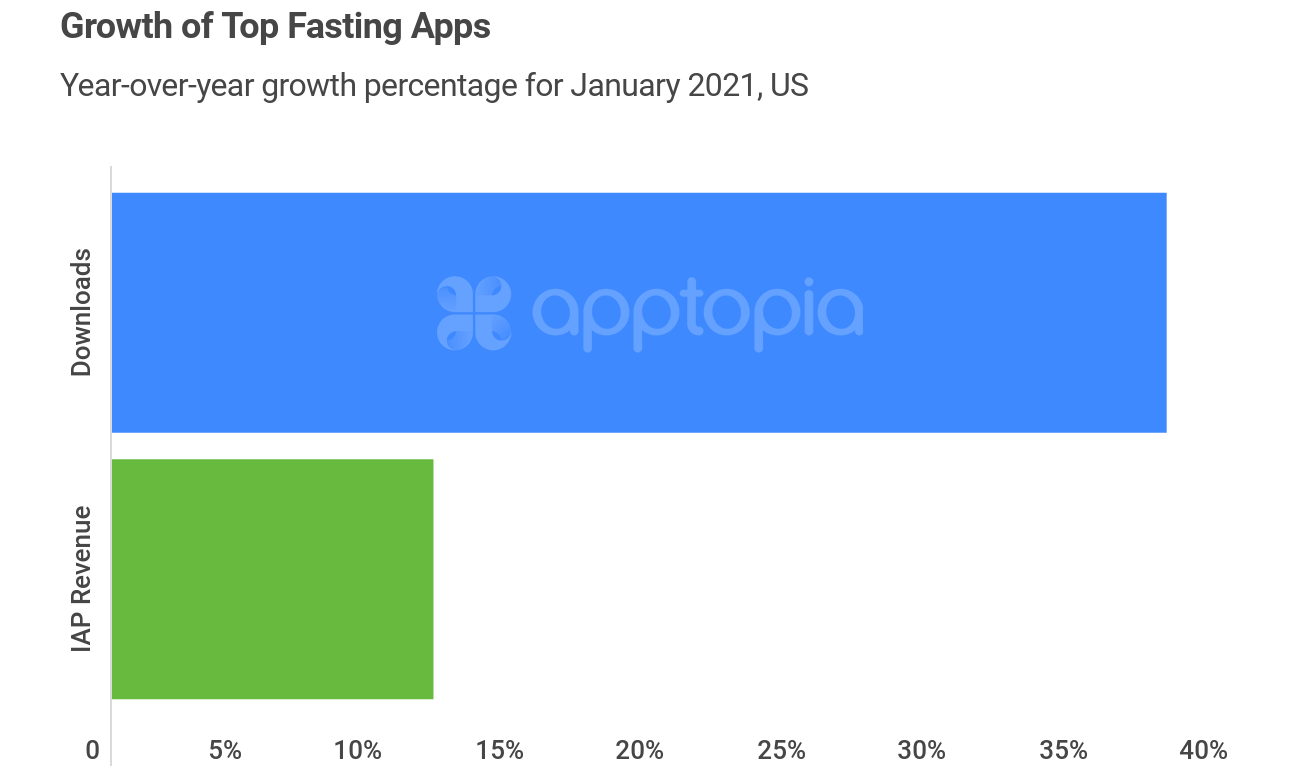
Top fasting apps, as a grouping, grew January installs 37.4% YoY. These are apps that help people track and manage their intermittent fasting. Fasting done incorrectly can certainly be dangerous to one’s health but there are people and studies that claim it can increase well-being from a physical and mental standpoint. This January, Fastic was the top fasting app in the US, with 600k downloads, 329% more than its closest competitor.
CALORIE COUNTERS + MEAL PLANNERS FOR WEIGHT LOSS
Downloads for the top apps in this subcategory sank 18.7% YoY as a whole. IAP revenue also sank to the tune of 20.5%. It’s possible the pandemic has made diet changes harder to accomplish given our limited sources of joy these days. I know for me, food is now a bigger pick-me-up than it used to be.
MyFitnessPal is the top app in this category for both January downloads (703k) and IAP revenue ($2M). It was the top download getter in 2020 as well, but Weight Watchers was the top app in terms of revenue last year. MyFitnessPal used to be owned by Under Armour but they sold it last November to an investment firm for $345 million, after purchasing it for $475 million in 2015.
The app that improved both its downloads and IAP numbers the most since last January is Fitingo, growing 144% and 194.5%, respectively. Fitingo launched mid-2019 so it’s still fairly new compared to its competitors in this space, so faster growth is somewhat expected. People do seem to like it - Apptopia’s Review Analysis labeled 95% of the written user reviews left in January 2021 for Fitingo as being Positive. Reading through the reviews labeled as Positive, I noticed two recurring items; people really like that they can pick their level of difficulty and that there is a personal trainer that will respond to them in a timely manner after messaging them. This is also one of the few apps I’ve seen with the ability to purchase a week-long subscription (with or without a free trial) instead of committing for a month.
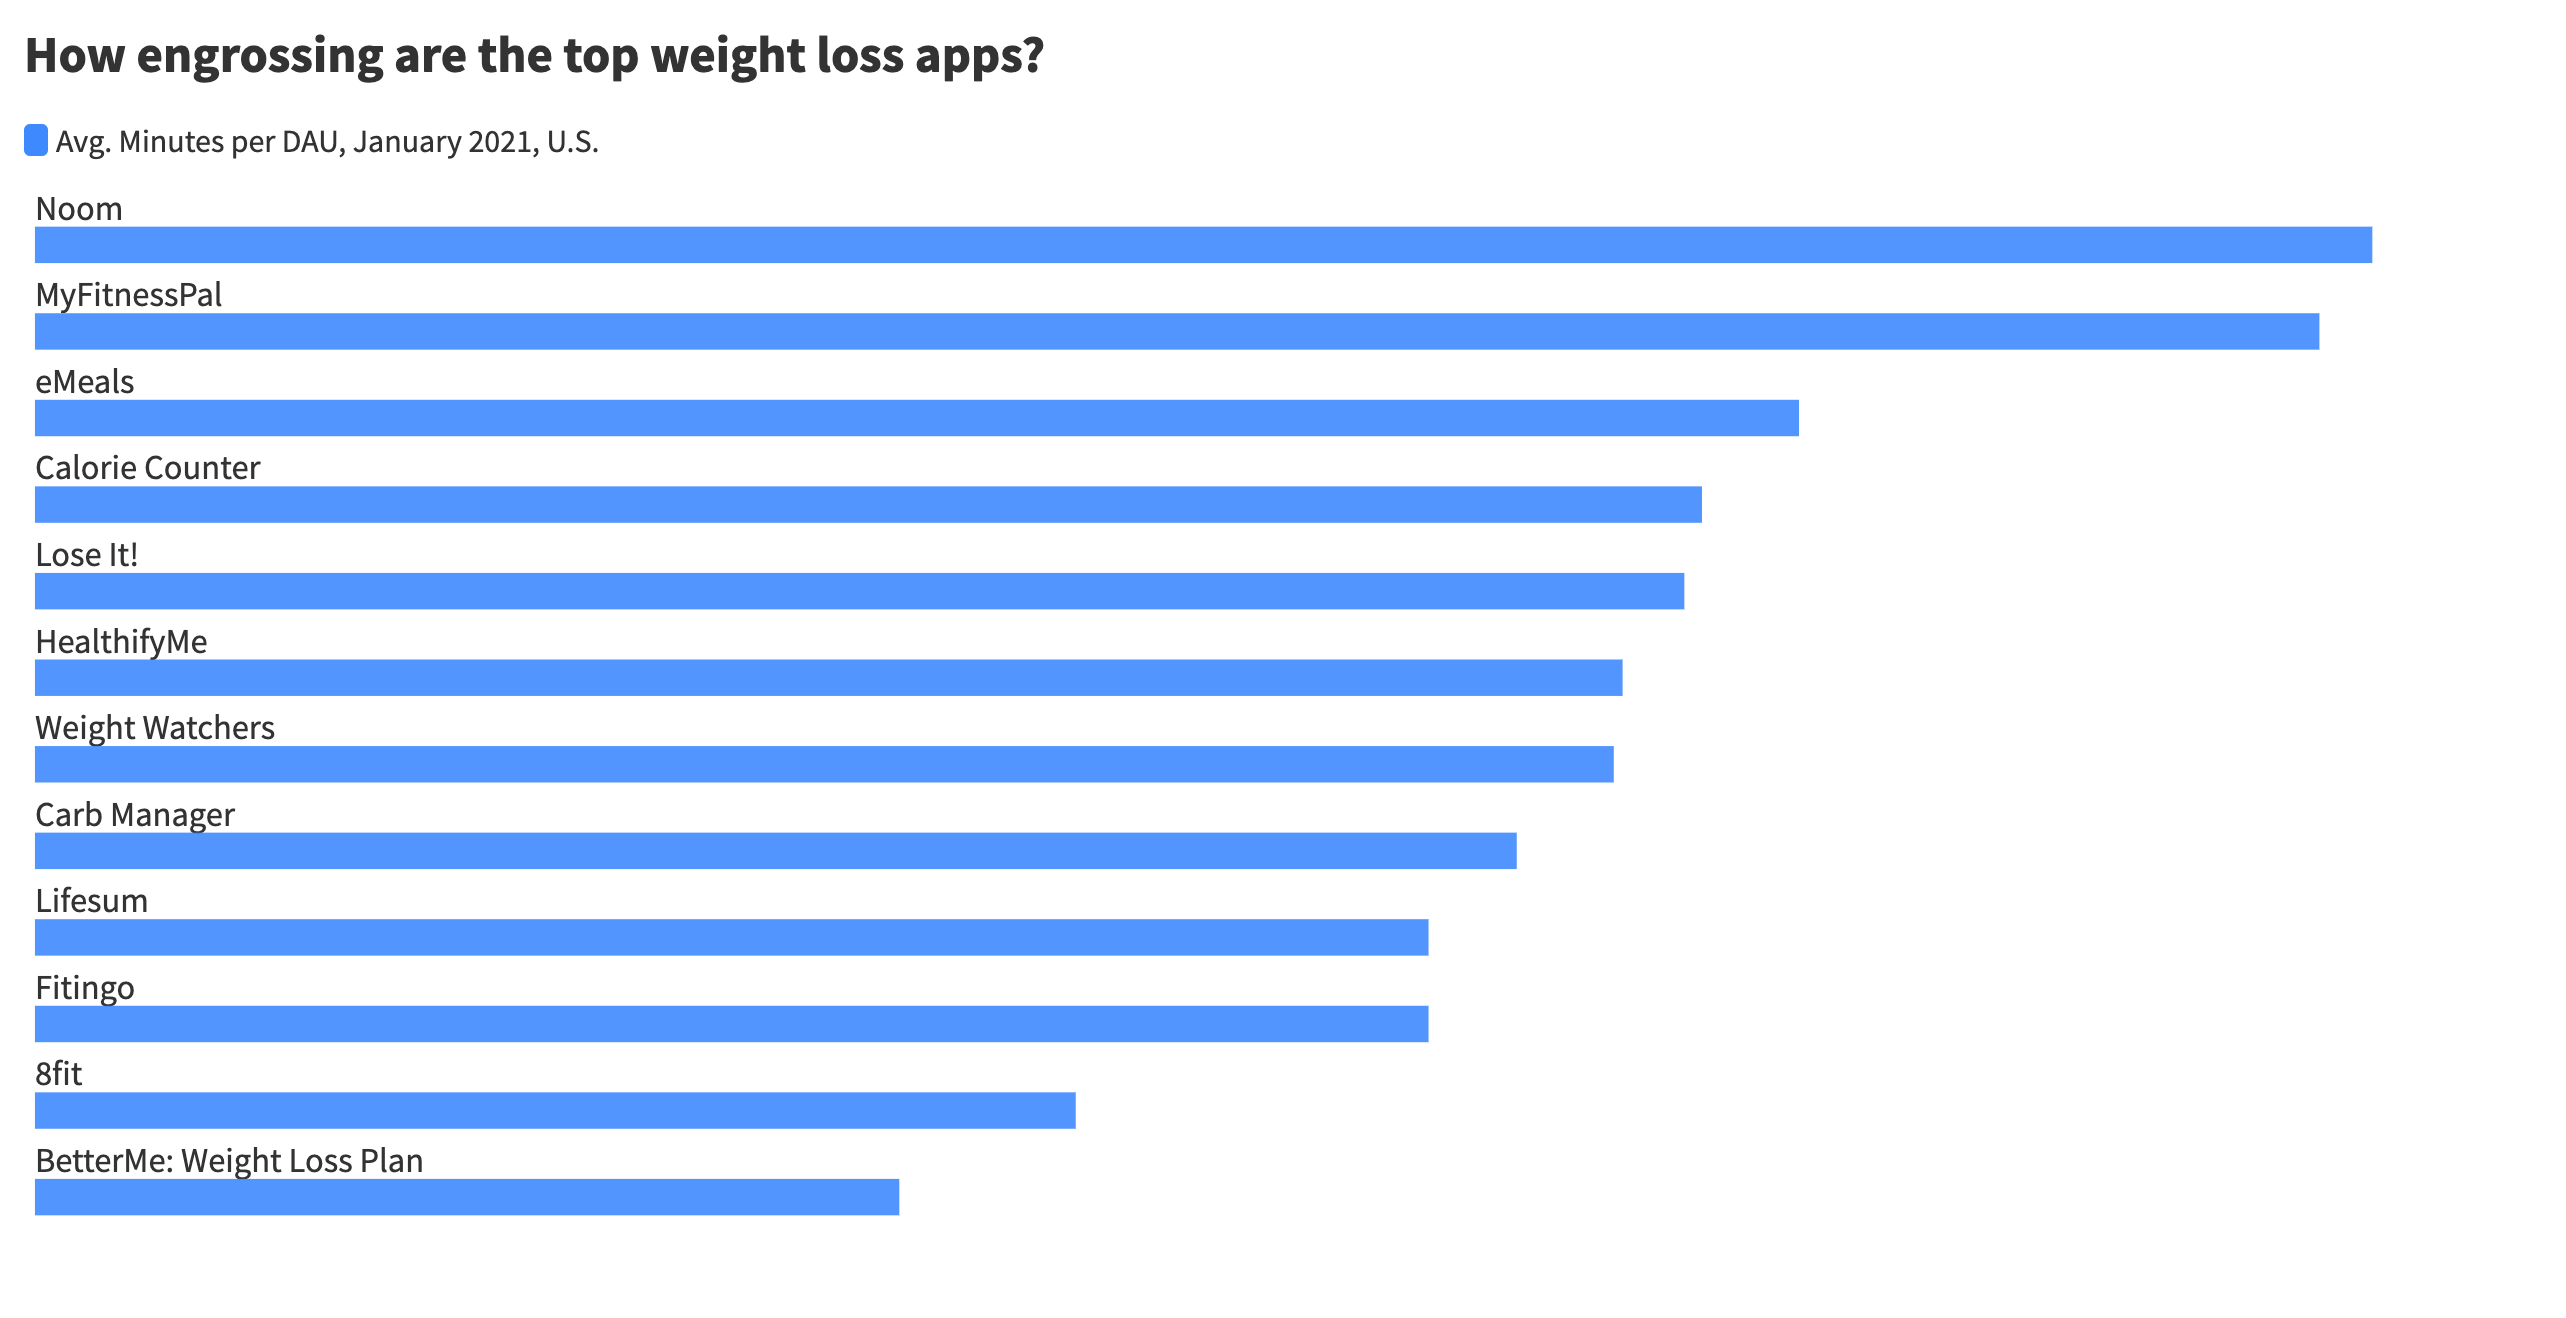
The most engrossing app in this subcategory is Noom, followed closely by MyFitnessPal. After these two, there is a big of a drop-off. For Apptopia, when we say “engrossing,” we simply mean the average number of minutes spent by someone in the app on a daily basis. The longer you spend in an app, the more engrossed you are with it. I’m mostly including this image because I know Noom has been spending a good chunk of money on advertising across several mediums. It appears users are giving it a fair shake.
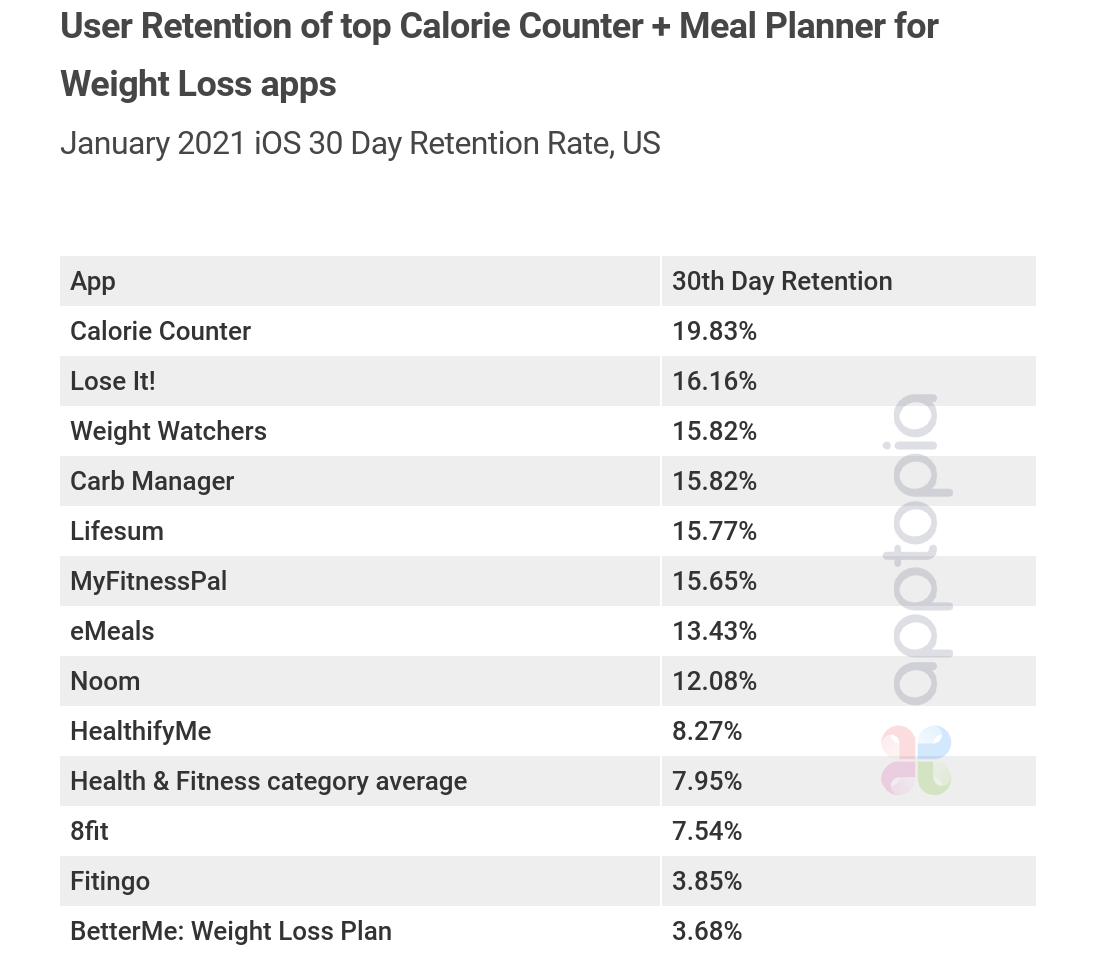
This subcategory of apps generally performs far better than the Health & Fitness category average. Fitingo, which we talked highly about above, has a very low retention rate compared to its competition. That may be because it does have a strong workout component to it and typically workout apps, which I’m touching on next, have a lower retention rate than apps demanding less physical activity.
WORKOUT APPS
Top apps whose main focus is providing physical workouts for you to do depending on your goals, and showing you how to do them, have grown downloads 53% YoY in the month of January. IAP revenue for these apps has fallen 16% YoY. I think in a lot of cases where we are seeing IAP revenue fall, but downloads rise, is less about poor conversion and more about the increased availability and length of free trials. It’s because of this that we will pick one of these subcategories and dive into it to see if the apps were able to use the momentum gained from all of the new users to generate more revenue.

FitOn Workouts & Fitness Plans topped this subcategory for January downloads with 485k. Fitness Coach grew the fastest (1086.5%). Again, it’s a newer app having launched in 2019. A more established app in SWEAT was the top revenue generator for the month, hitting $931k. Fitness Coach was again the fastest grower here, generating 166583% (not a typo) more this January than last. They really didn’t bring in much money last year, which is why the jump is so large. As far as established apps go, FitOn grew the most at 646%.
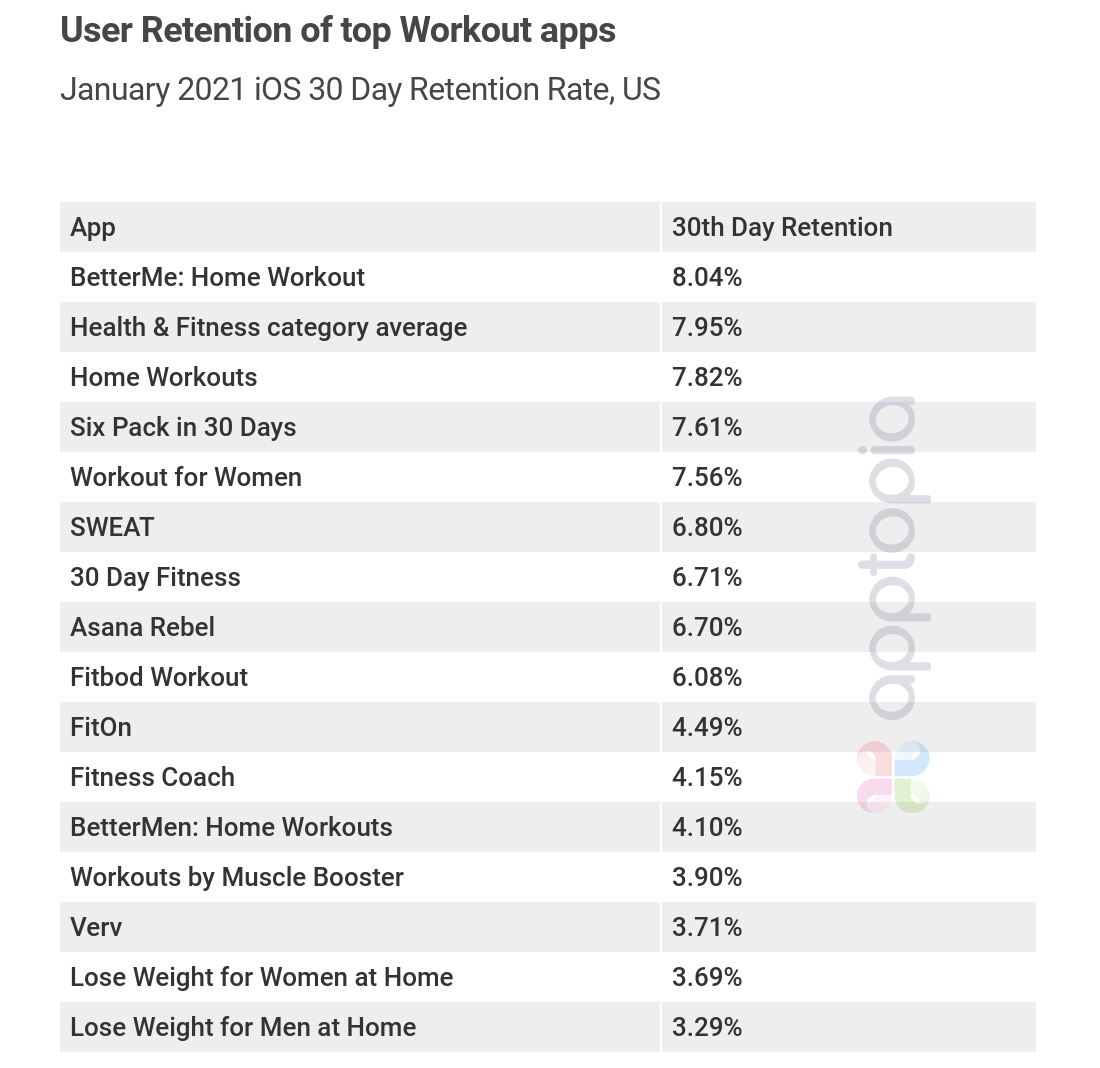
As alluded to in the section prior, retention rates for workout apps average lower than the category as a whole and lower than of other Health & Fitness subcategories. Just like actually working out, retention is hard to come by.
FITNESS TRACKER APPS
Apps such as Strava and Nike Run Club are what we’ve slotted into this subcategory. They track distance and can hook in to existing health platforms such as Apple’s to provide further metrics, but their publishers do not make a specific piece of hardware like Fitbit or Garmin do.
![]()
Nike Run Club topped the grouping for absolute downloads with 201k, while Da Fit was the fastest growing at 68.5% YoY. There’s not a ton of money made by these apps, with the exception of Strava, which generated $439k last month.
![]()
The above shows how the share of the market shook out for the top fitness trackers during the month of January by average daily active users. There’s a pretty good spread here without any dominant players. Shoe companies own three of these apps with Nike being the obvious one. Runkeeper is owned by Asics and Map My Run is owned by Under Armour. Through these apps, the companies can find out more about their customers and tailor their products and marketing to them.
MEDITATION APPS
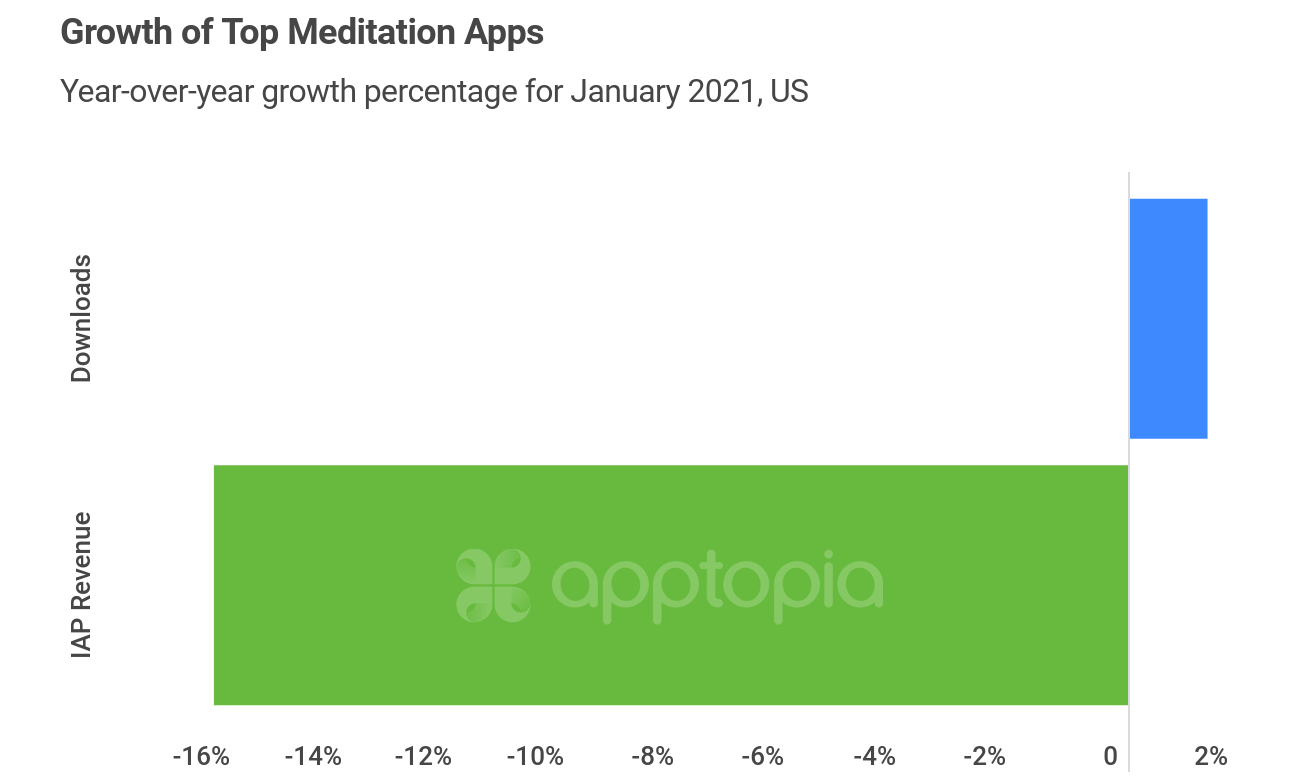
There are some big apps in this grouping, including household names Calm and Headspace. They’re so big that they essentially determine the fate of the subcategory as a whole. Still, there were apps that grew revenue, including BetterMe: Meditation & Sleep at 124% YoY.
MENTAL HEALTH APPS
Yes, I could have grouped meditation apps into this subcategory but some of them are so prominent that I wanted to split them out. For this data, we’re focusing on apps like BetterHelp and Talkspace.

You’ll notice performance data is down significantly from last year, which is not something many would have suspected given the pandemic’s toll on mental health. I reviewed 30 apps and each one of them saw a decrease in downloads year-over-year. These apps did make a lot of splashy headlines last year and this could be a case of water finding its level. Another theory is that because the chats taking place within these apps are very private and personal, and there has been an increase in awareness that the internet and our favorite platforms may be less secure than once thought, people could be thinking twice about whether a mobile app is the best place for them to share.
To learn more about the data behind this article and what Apptopia has to offer, please reach out to Connor Emmel at cemmel@apptopia.com.


Sign up to receive our stories in your inbox.
Data is changing the speed of business. Investors, Corporations, and Governments are buying new, differentiated data to gain visibility make better decisions. Don't fall behind. Let us help.


Sign up to receive our stories in your inbox.
Data is changing the speed of business. Investors, Corporations, and Governments are buying new, differentiated data to gain visibility make better decisions. Don't fall behind. Let us help.


