
Introduction
Welcome to the March Apartment List National Rent Report. This month’s data represents the clearest indication yet that rent prices are rebounding in markets across the country. Our national index increased by 0.7 percent over the past month, the largest monthly increase since the summer of 2019.
The data continue to exhibit significant regional variation, but the days of plummeting rents in pricey coastal markets appear to be coming to an end, with cities such as San Francisco and Seattle experiencing positive month-over-month growth for the first time since the start of the pandemic. At the other end of the spectrum, many of the mid-sized markets that have seen rents grow rapidly through the pandemic are showing that there’s still steam left in the current boom.
National index shows largest monthly jump since 2019
Our national rent index is up by 0.7 percent month-over-month, representing the second straight month of positive rent growth and the largest monthly increase since June 2019, when the market was in the middle of its summer boom. For comparison, in the previous three years, the average month-over-month rent growth in February was 0.3 percent. In other words, this month’s increase was more than double the prior-year average for this time of year. This is the second straight month that rent growth has outpaced the average of prior years. Year-over-year, rents are now down by 0.8 percent nationally, an increase from the 1.2 percent year-over-year decline that we reported last month.
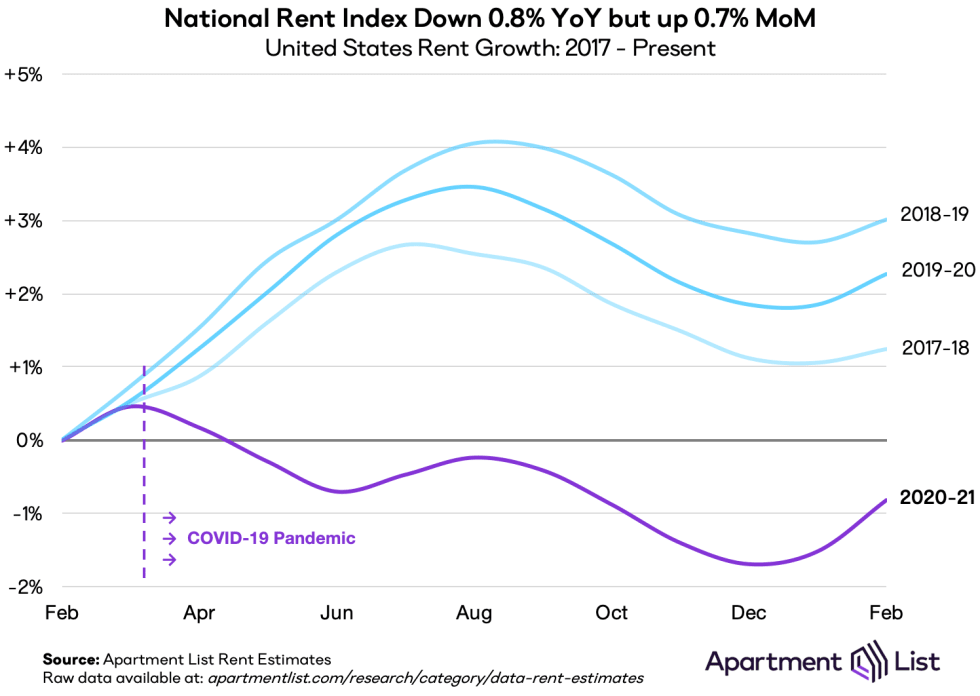
In fact, our national index has not been significantly disrupted since the early stages of the pandemic. Rents fell by 1.2 percent nationally from March through June of 2020, but rents are now just 0.1 percent lower than they were last June. Over the past eight months, national rent growth has been largely in line the seasonal trend that we’ve observed in prior years. That said, stability in the national index has been masking significant regional variation below the surface, as some markets had been continuing to watch rents plummet, while others experienced a pandemic-related boost to demand. This appears to be the month where steep rent declines are bottoming out, but booming markets are continuing to see prices climb.
Rents in coastal superstar cities have bottomed out
San Francisco has consistently made headlines throughout the pandemic for the staggering rent declines that have led the nation. Rents in San Francisco are down by 26 percent year-over-year, and while prices are far from returning to pre-pandemic levels, we appear to have hit the turning point where the city’s price correction has officially bottomed out. In February, rents in San Francisco increased by 1.2 percent. This is the first monthly increase in San Francisco since the start of the pandemic. For comparison, San Francisco rents fell by an average of 3.4 percent each month from April through December 2020.
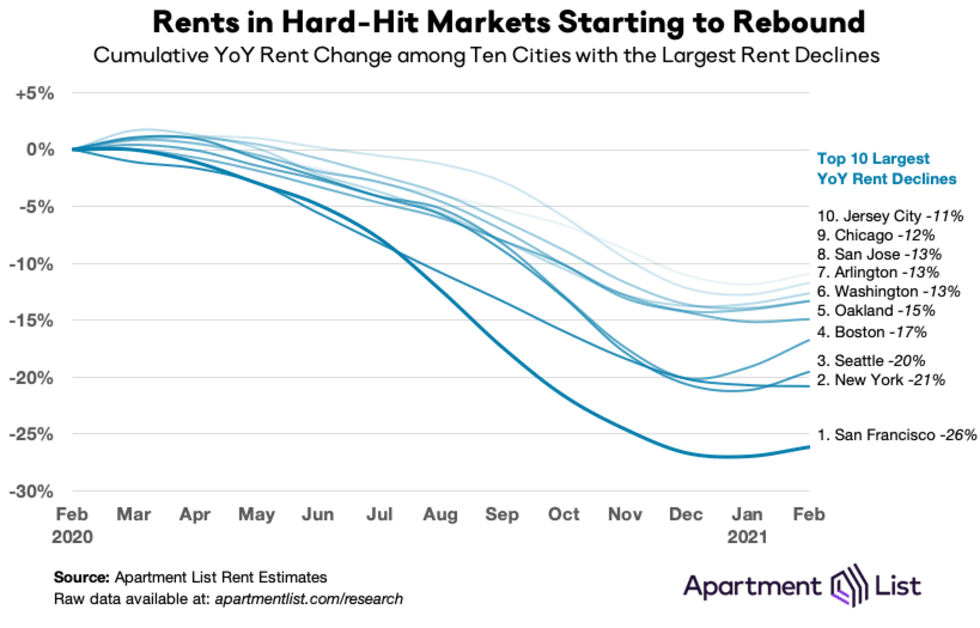
Beyond San Francisco, we’re seeing a similar trend playout in nearly all of the cities where rents have been falling fastest. Nine of the ten cities with the sharpest year-over-year rent declines experienced positive rent growth this month. For five of these cities, this was the first monthly increase since the start of the pandemic, while the other four are continuing a trend that began last month. In Boston, rents jumped by 3 percent month-over-month, the largest increase among the nation’s 100 largest cities. New York City is the only market on this list where rents continued to fall this month, but even there, the decline was just 0.1 percent, compared to an average monthly decline of 2.4 percent in the preceding nine months.
Affordable mid-size markets continue to boom
As the expensive coastal cities discussed above watched rents plummet, a separate group of mid-sized markets were experiencing rapid increases in rent prices as the pandemic and remote work spurred demand for the space and affordability that these cities offered. While rent growth in these cities has shown some signs of slowing recently, this month’s data shows that there’s still steam left in the current boom.
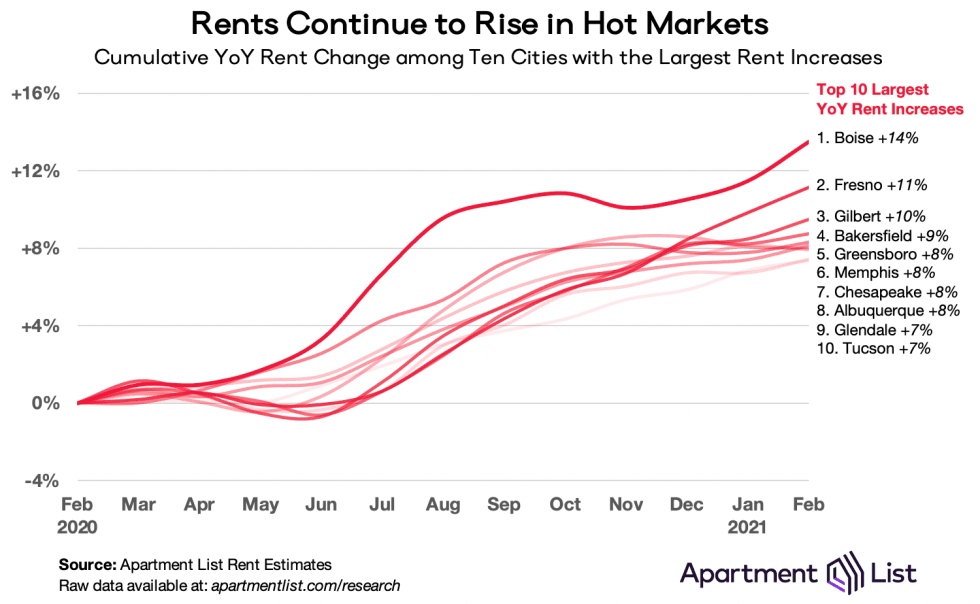
Boise currently ranks #1 for fastest year-over-year growth, and although growth there was fairly flat throughout most of the fall, this month brought an increase of 1.8%, the #4 largest monthly increase among the 100 largest cities in the U.S. Rents in Boise are now up by 13.5 percent year-over-year. All of the 10 cities with the fastest year-over-year rent growth saw prices increase this month. In most cases, rent growth in these markets has been fueled by a tightening of supply; we have observed local vacancy rates plummet as more renters compete for fewer available apartments. While some of these markets are seeing rent growth start to flatten out a bit, prices are continuing on an upward trajectory.
COVID shakeups have led to some convergence of expensive and affordable markets
As described above, affordability has been a key determinant of whether cities are experiencing falling or rising rents during the pandemic. The relationship is made more explicit in the chart below, which plots rent levels against rent changes for the 50 largest cities in our data. There is a clear correlation between the two; the cities that had the highest rents in March (moving right along the x-axis) have seen the steepest rent drops since then (moving down along the y-axis).
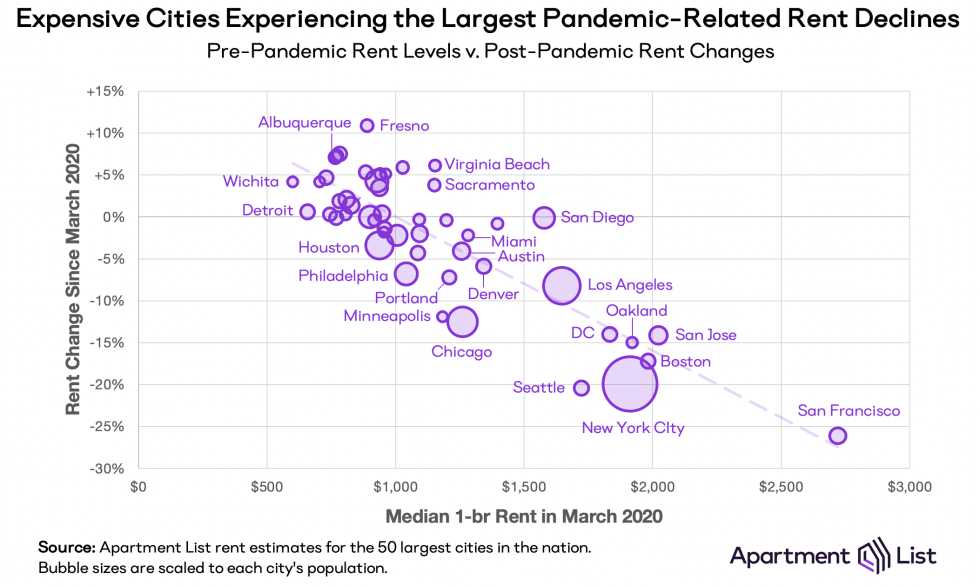
Meanwhile, the cities that had the most affordable rents at the onset of the pandemic are most likely to have seen prices climb. This has led to a certain degree of convergence in rent prices across these cities – the most expensive markets have gotten somewhat more affordable, while the most affordable markets have grown pricier. For example, last March, the median 2-bedroom rent in San Francisco was $3,146, which was 3.4x the $929 median for a 2-bedroom in Boise. As of this month, the 2-bedroom median in San Francisco has dropped to $2,322, while in Boise it has grown to $1,044, meaning that rents in San Francisco are now just 2.2x those in Boise. While still a significant price difference, the affordability gap has narrowed substantially.
Conclusion
Since the start of the COVID-19 pandemic, we have witnessed significant disruptions to rental markets across the country. Social distancing and remote work changed what people want in a home, while many renters were thrust into immediate and unexpected financial hardship as layoffs and furloughs rippled through the economy. These sudden changes to budgets and preferences led to a convergence in rental prices across the U.S. – the most expensive markets saw rents fall rapidly while a number of more affordable mid-sized cities experienced accelerating rent growth. This month’s data indicates that the markets where rents have been falling rapidly have reached a turn point. The booming markets are still seeing prices rise, but in many cases, that growth is flattening somewhat. While remote work and economic fallout of the pandemic will undoubtedly continue to impact local rental markets going forward, the way that these trends continue to play out may now start to become more nuanced and gradual.
A Note on Our New Rent Estimate Methodology
Apartment List has long been committed to making our rent estimates as accurate and transparent as possible. With this in mind, we recently introduced a new methodology that rethinks our approach while building upon the robust foundation that was already in place. The most significant change in our new methodology is that we are now aiming to identify transacted rent prices, as opposed to the listed rent prices on which our old methodology was based. This controls for price fluctuations that arise over the course of a vacancy. Using these transacted prices, we calculate rent growth rates based on a same-unit approach that controls for compositional changes in the rental stock. As before, we continue to combat luxury bias in our rent data by using fully-representative median rent statistics from the Census Bureau’s American Community Survey.
To learn more about the data behind this article and what Apartment List has to offer, visit https://www.apartmentlist.com/.


Sign up to receive our stories in your inbox.
Data is changing the speed of business. Investors, Corporations, and Governments are buying new, differentiated data to gain visibility make better decisions. Don't fall behind. Let us help.


Sign up to receive our stories in your inbox.
Data is changing the speed of business. Investors, Corporations, and Governments are buying new, differentiated data to gain visibility make better decisions. Don't fall behind. Let us help.