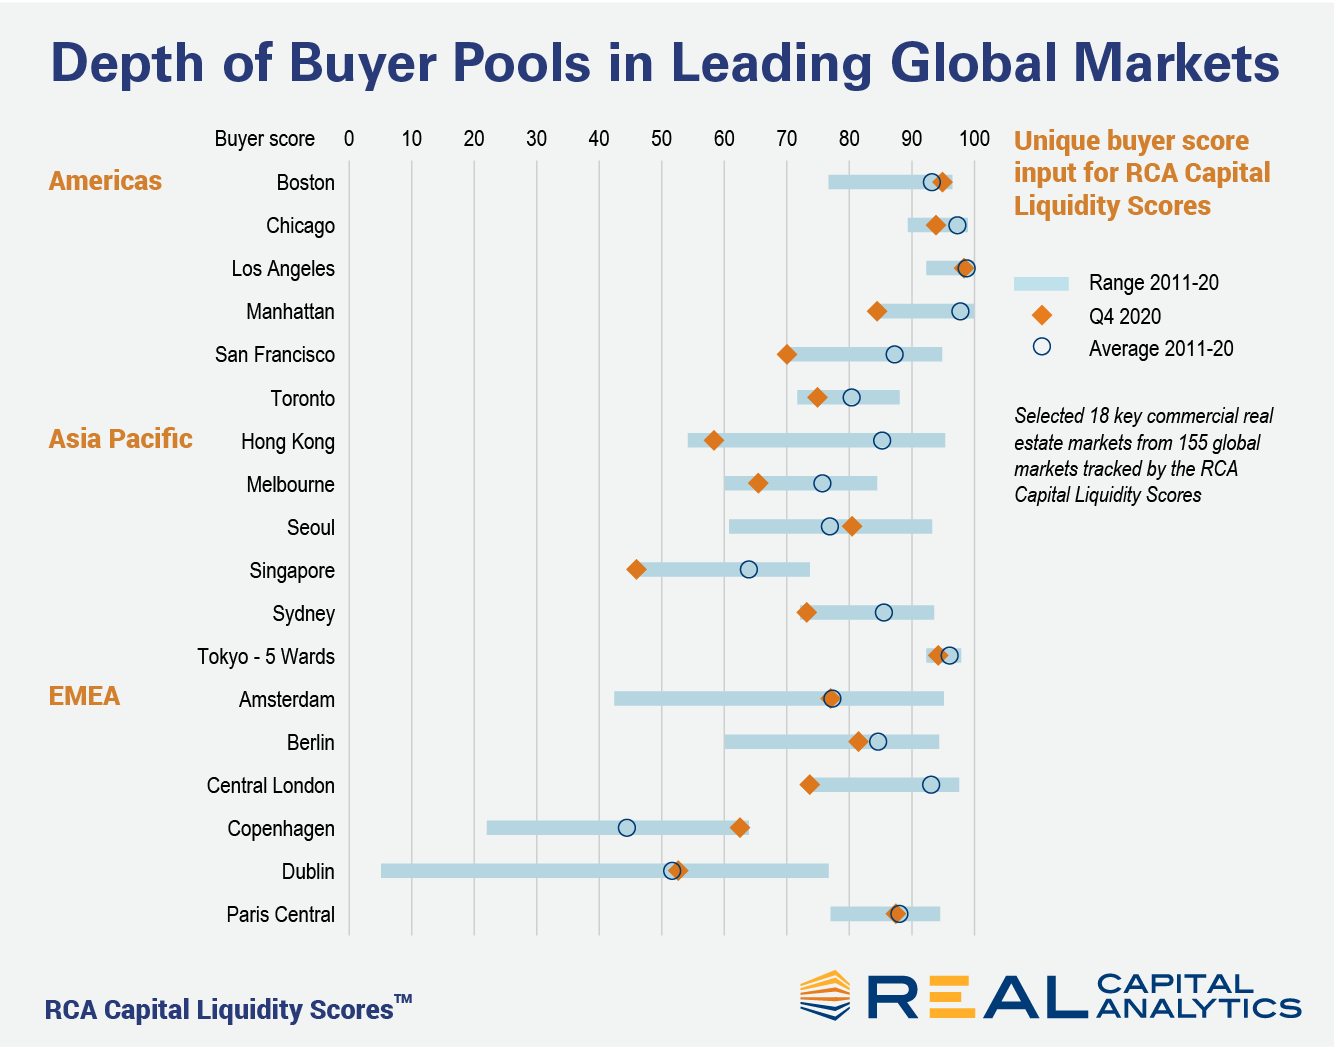
The number of unique, active buyers in a market is a key signal for liquidity and one of six measures that Real Capital Analytics uses to calculate the RCA Capital Liquidity Scores. In the chart below we show 18 leading commercial real estate markets and the buyer count measure for Q4 2020 compared to the average and range of the past 10 years.
Four of the markets — Manhattan, San Francisco, Singapore, Central London — show unique buyer scores at their lowest level of the past decade. Markets where the buyer score is near the decade-low are Toronto, Sydney, Melbourne, and Hong Kong.
The story is not so gloomy for Boston, where there was only a marginal annual decline in the buyer pool despite the disruptions caused by the pandemic, or Los Angeles, where the Q4 2020 score was near the top of its range. And, in Copenhagen, the score of unique buyers jumped to a record high in the third quarter of 2020, falling back slightly at the close of the year. Here both the office and apartment sectors posted record high buyer count scores.

To learn more about the data behind this article and what Real Capital Analytics has to offer, visit https://www.rcanalytics.com/.


Sign up to receive our stories in your inbox.
Data is changing the speed of business. Investors, Corporations, and Governments are buying new, differentiated data to gain visibility make better decisions. Don't fall behind. Let us help.


Sign up to receive our stories in your inbox.
Data is changing the speed of business. Investors, Corporations, and Governments are buying new, differentiated data to gain visibility make better decisions. Don't fall behind. Let us help.


