
Source: https://www.corelogic.com/blog/2021/3/home-sales-reveal-new-insights-into-current-recession.aspx
Historically, when it comes to recessions, home prices don’t always dovetail with economic instability. In fact, home sales numbers have a much tighter relationship with recessions. The current recession is unique, however, and that uniqueness can be seen in the behavior of the national housing market.
Recessions Usually Manifest Themselves in Sales, Not Prices
Figure 1 depicts year-over-year growth in real home prices and new home sales (the historical trend is removed from both series, so that they both oscillate around zero)[1]. The pink bars show recession periods. During these periods, sales are more volatile, displaying more extreme fluctuations during downturns than home prices. Though prices do drop during recessions, the only time they have done so severely was in the Great Recession (the ‘housing’ recession)[2]. Even so, the relative decline in sales was still greater than the decline in price. As such, we can say that the housing volume cycle is far more extreme than its price cycle.
Figure 1: Year-Over-Year Growth (Deviations from Trend) in National Home Prices and National New Home Sales, Jan 1980-June 2020
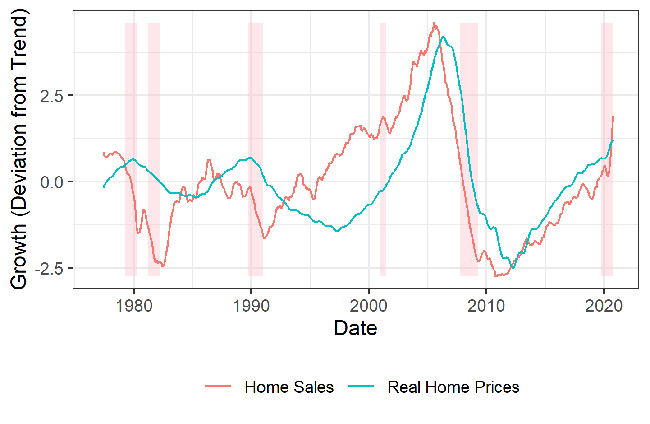
There are good reasons that sales are more sensitive than prices. Home prices are generally sticky downwards. If homeowners have the expectation that the economy is going to slow, they will logically delay the sale of home, rather than accept a potentially lower price. There are always exceptions to this. Some people may be under financial distress and need to sell; others may relocate for a new job, get divorced or sell a deceased person’s estate amongst other things that sometimes cannot wait. This leads to only small drops in prices, but larger drops in sales and residential investment.
This recession is an exception. Prices have risen a lot in most places. There are several hypothesized reasons for this. First, mortgages rates at an all-time low are causing a spike in demand. Second, older owners have chosen to delay selling, restricting supply. Third, forbearance programs have delayed distressed sales. Fourth, the coronavirus pandemic has led to a shift in preferences and reallocated demand to less dense areas leading to more rapid price gains in suburbs, for instance. Combined, these factors have led to, on aggregate, a large increase in prices that is not typical recession behavior. However, sales volumes were down during the Spring, in line with typical recession behavior.
Sales Have Disproportionately Been in High-Priced Areas during the Pandemic
Figure 2: Representation Ratio of Low-Price and High-Areas during Jan 2017-Oct 2020
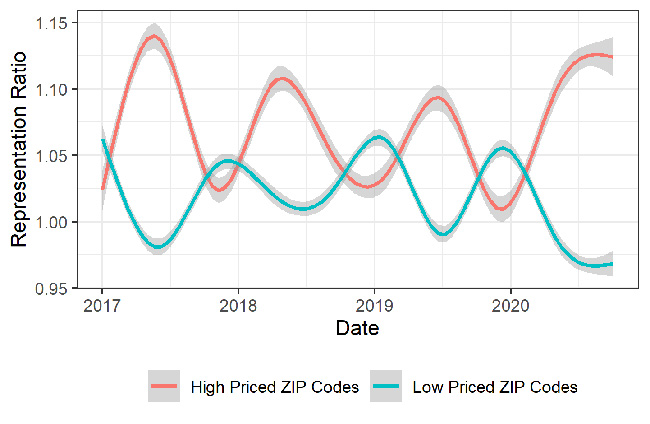
The aggregate price picture, however, masks sharply divergent submarkets. Figure 2 shows the representation ratio of high-priced and low-priced ZIP codes using CoreLogic public records. The figure includes 7,385 ZIP Codes**[3]**. The representation ratio is the share of total sales in a ZIP code divided by its share of the residential housing stock according to CoreLogic’s Public Records data**[4]**. In short, this graph shows that home sales in higher priced areas are making up a larger representation of sales today.
We see that sales activity has diverged from recent trends, with sales in high-priced suburbs driving an overrepresentation of expensive submarkets. This is likely a reflection of the economic fundamentals at play. Higher income jobs have generally been able to maintain their employment and take advantage of record low interest rates to gain access to bigger, more expensive homes, hence an increase in sales in those areas. Lower income jobs, especially in the hospitality, travel and restaurant industries, have been lost, meaning that they cannot take advantage of the drop-in interest rates, and sales in those areas are relatively fewer than before.
In addition, higher-income jobs tend allow working from home during the pandemic, but low wage jobs, which are more likely to be in the service sector or manufacturing, do not have the same luxury. A computer programmer can easily relocate from San Francisco to Boise and keep their same job, but a factory worker in Fremont would have to stay put to keep their job.
Price-Tiered indexes indicate that prices are up in across the board, but as Figure 1 shows, prices only tell part of the story for the housing market and recessions. In terms of prices, the housing market has proven to be protected from the COVID-19 recession, but when we look at sales activity, there are pockets that have not been able to escape it.
Once pandemic-induced pressures ease, if low priced areas re-emerge as a higher share of sales as expected, what ramifications will this have for prices? One might expect that, since the lower tiers are experiencing higher appreciation now, prices could accelerate even further.[5] However, it is more likely that, as the underlying composition of sales returns to more of its historical norm, so too will prices.
If the drive away from density continues, however, it is also possible that the representation ratios will continue their current trend. If this is the case, then we would still expect a slowdown in appreciation, since the restrictions on home building imposed by the pandemic will loosen in the future, removing one of the current drivers of appreciation.
Overall, it is important to remember that prices show what happening in the submarkets that are selling right now, and don’t necessarily reflect what is happening in the markets that aren’t selling. The appreciation seen in the pandemic is a snapshot that is mostly showing what is happening in more expensive markets. As sales in lower priced areas pick up again, it seems hard to predict a future where the unexpected appreciation during the pandemic continues into next year. Indeed, CoreLogic’s HPI Forecast is currently predicting appreciation of 2.9% year over year price growth from December 2020 to December 2021, very much a return to normalcy.
[1] Trend is removed by subtracting the average year over year growth rate from each data series. The figure depicts the 6-month moving average of these.
[2] Outside of 2007, the steepest decline in prices any time after 1980 was 5% in the early 1980s recession. https://www.corelogic.com/blog/2020/11/annual-u.s.-home-price-appreciation-jumped-to-six-year-high-in-september.aspx
[3] A ZIP code is defined as high-priced if it is the top 25 percent of its metro area and low-priced if it is in the bottom 25 percent. Percentiles are based on median sale price for the ZIP code for 2018. This is not price per square foot, so virtually all the high-priced ZIP codes are suburban, since the square footage of such properties is so much higher.
[4] For instance, if there were only 2 ZIP codes, one with 5 houses and another with 10, and in the month of December 1 house sold in the first zip code and 4 houses sold in the second. The representation ratio for the first would be (1/(1+4))/(5/(5+10))= (1/5)/(1/3) = 0.6 and the second would be (4/(1+4))/(10/(5+10))= (4/5)/(2/3) = 1.2. If a ZIP code’s sales are an accurate representation of its stock, then the ratio is 1. Overrepresented ZIP codes have a ratio above 1 and underrepresented ZIP codes have a ratio below 1.
**[5]**Gains amongst low-priced homes have well exceeded 10% in most markets according to the latest Case-Shiller HPI release. https://www.corelogic.com/blog/2021/1/u.s.-case-shiller-home-price-index-hits-yet-another-new-high.aspx
To learn more about the data behind this article and what CoreLogic has to offer, visit https://www.corelogic.com/.


Sign up to receive our stories in your inbox.
Data is changing the speed of business. Investors, Corporations, and Governments are buying new, differentiated data to gain visibility make better decisions. Don't fall behind. Let us help.


Sign up to receive our stories in your inbox.
Data is changing the speed of business. Investors, Corporations, and Governments are buying new, differentiated data to gain visibility make better decisions. Don't fall behind. Let us help.