
New York Had the Highest Net Out-Migration and Riverside Had the Highest Net In-Migration
In spite of the confluence of the COVID-19 pandemic and high unemployment in 2020, the total number of home-purchase loan applications rose by 11% from 2019. The need for more space (to accommodate an office or school room from home), reduced need to commute and record-low mortgage interest rates influenced strong buyer demand and may have offered an opportunity to relocate to more affordable areas.
For homebuyers, affordability, job opportunity and outdoor amenities are major driving factors of relocation. The following analysis uses the CoreLogic Loan Application Database to highlight the trends in owner-occupant homebuyer mobility and migration during the pandemic (April 2020 through December 2020), focusing on the metros with the most in- and out-migration of potential homebuyers.[1]
According to CoreLogic data, homebuyers relocating to another metro were often choosing metros that are either adjacent to their current location, had a lower cost of living, or both. Figure 1 shows the U.S. metros based on their net in- and out-migration. The top 10 metros with largest net in-migration and out-migration are labelled on the map.
Homebuyers continued to seek affordable metros adjacent to their current place of residence. This is a trend that was observed in prior years (see our previous analysis) and has persisted during the pandemic.
Figure 1: U.S. Metro Areas Based on Their Net In-Migration and Out-Migration of Homebuyers in 2020
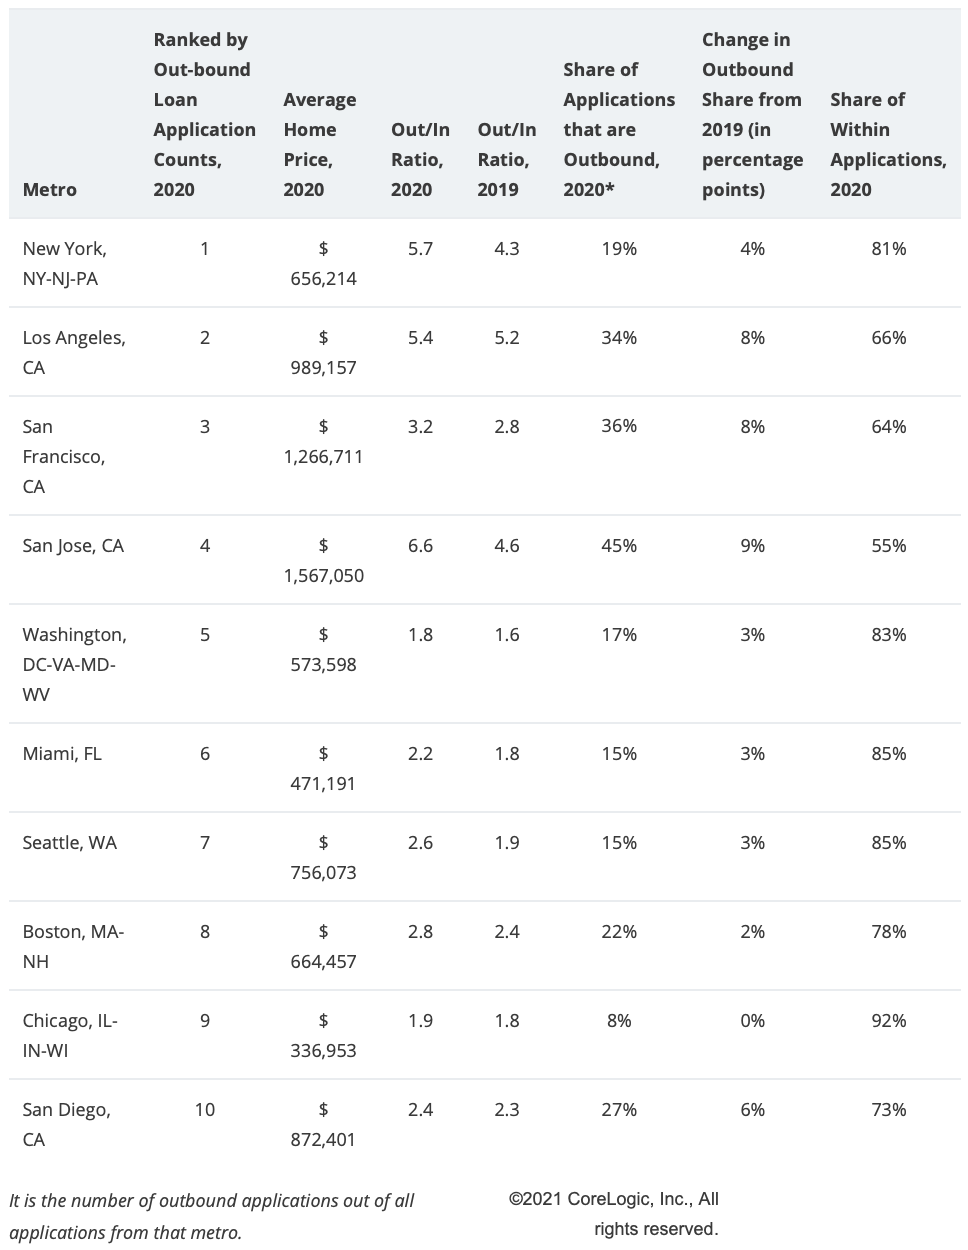
Figure 2 lists the top 10 metros with the highest out-migration loan application activity. Large coastal metros had higher outbound homebuying activity. New York experienced the highest net out-migration of homebuyers among all the metros over the last year, followed by Los Angeles, San Francisco and San Jose. The net out vs.in ratio was higher in all the top ten metros compared to the same period in 2019.
For example, for each incoming home-purchase application to New York, there were almost six potential homebuyers moving out of New York in 2020 (ratio of 5.7 in 2020 compared to 4.2 in 2019). New York lost a good share of its potential homebuyers to affordable neighboring metros, such as Philadelphia, Bridgeport, Poughkeepsie and Allentown, and warmer metros, such as Miami, Atlanta, Tampa and Charlotte. It is important to note, 81% of New York based potential homebuyers stayed in New York.
Figure 2. Top 10 Metros with Highest Outbound Loan Applications
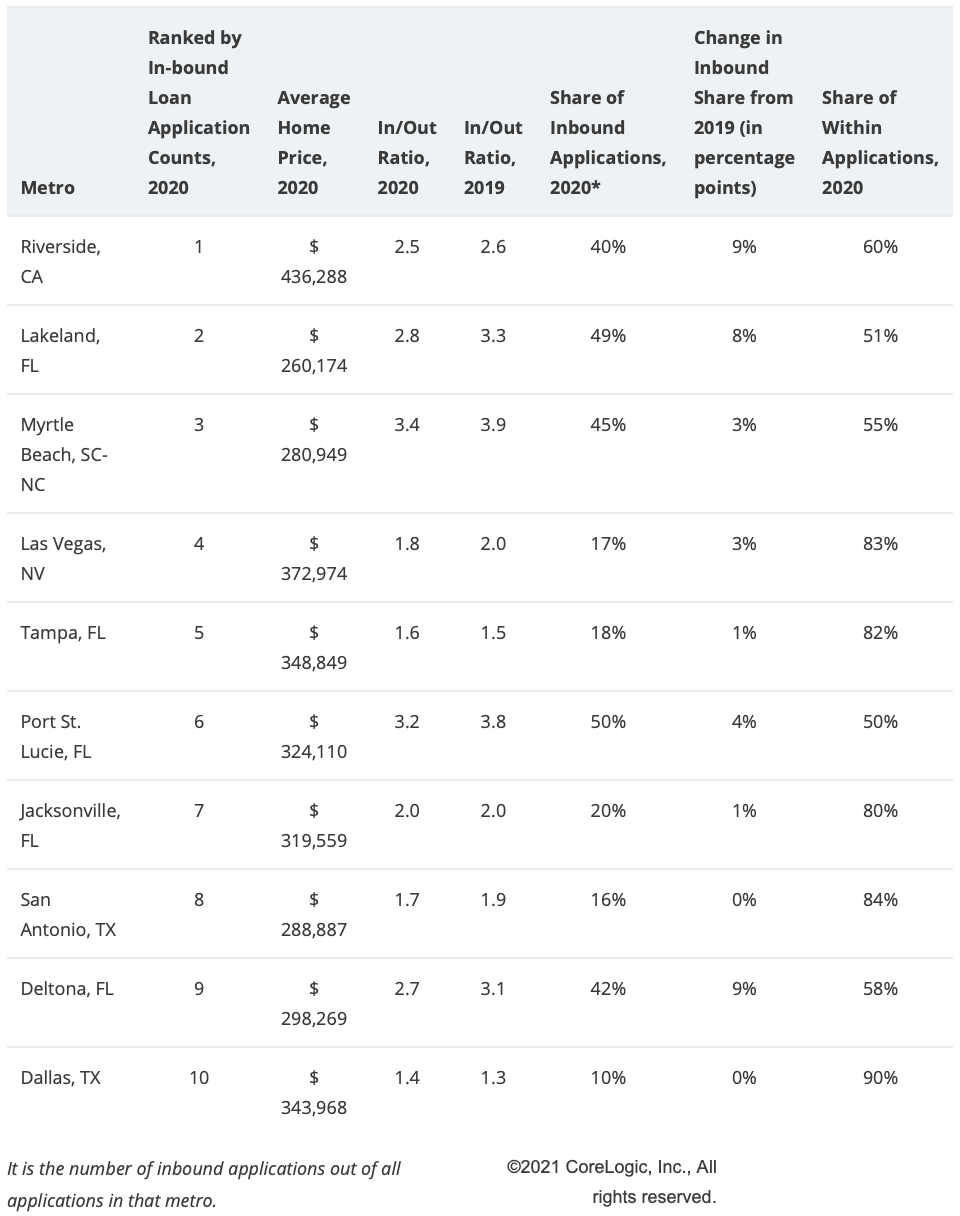
In contrast, Riverside, California, had the highest in-migration activity, followed by Lakeland, Myrtle Beach and Las Vegas (Figure 3). Los Angeles and San Diego had a net loss of potential homebuyers to Riverside. More than 29% of the overall applications in Riverside metro came from Los Angeles (compared to just 23% in 2019), mostly those seeking affordability. For example, the average home price in Los Angeles is more than double that in Riverside. Also note that while 40% of the applications came from non-Riverside residents, 60% of applications were from within Riverside.
Figure 3. Top 10 Metros with Highest Inbound Loan Applications
Overall, about 17% of the mortgage applicants in 2020 chose to move to another metro compared to 16% in 2019. However, the share of mortgage applicants in the top 10 metros with largest net out-migration chose to move to another metro went up by 3% in 2020 to 21% from 2019. The net out vs. in ratio of applications rose in 2020 for all these 10 metros compared to 2019.
Taken together, the most expensive metros experienced the highest net out-migration and, in contrast, more affordable metros had net in-migration of homebuyers. Looking forward, as affordability seems to be an important consideration for a homebuyer, we are likely to see more applicants moving to less expensive markets in the near future.
©2021 CoreLogic, Inc. , All rights reserved.
[1] The analysis is based on all home-purchase mortgage applications, accepted or not, from April 2020 to December 2020 and compared to applications from April 2019 to December in 2019. Investors and second-home buyers were excluded in the analysis. The metros are at Core-Based Statistical Areas (CBSA)-level.
To learn more about the data behind this article and what CoreLogic has to offer, visit https://www.corelogic.com/.


Sign up to receive our stories in your inbox.
Data is changing the speed of business. Investors, Corporations, and Governments are buying new, differentiated data to gain visibility make better decisions. Don't fall behind. Let us help.


Sign up to receive our stories in your inbox.
Data is changing the speed of business. Investors, Corporations, and Governments are buying new, differentiated data to gain visibility make better decisions. Don't fall behind. Let us help.