
The housing market, like many segments of the economy, had a unique year in 2020. Pandemic-induced demand – for homes with more living space and located in lower density neighborhoods – coupled with historically favorable mortgage rates and declining for-sale inventories led to the most competitive market seen since at least 2008. Buyers competing for fewer properties on the market were generally willing to offer relatively more than they have been in recent years, leading to the ratio of closing price to listing price reaching the highest level since at least 2008.
Sellers Continue to Receive More Than Asking Price
Market competition herein relies on the Buyer/Seller Market Indicator from CoreLogic ListingTrends. This indicator measures the ratio of median sold price and the median list price. The higher the ratio, the closer the selling price is to the listing price.
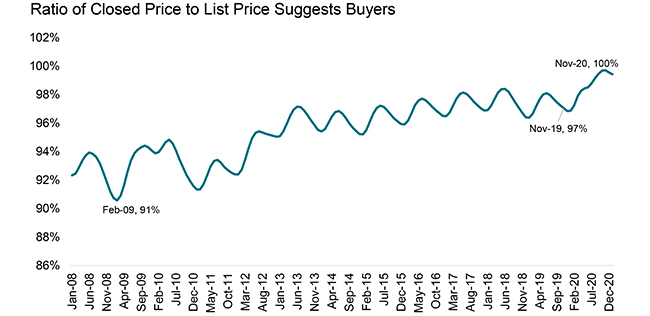
Figure 1 illustrates the national Buyer/Seller Market Indicator trend going back to the beginning of data series in 2008. The Indicator follows a distinct seasonal pattern with the annual peak in summer months (May thru June) and troughs in December or January. After some volatility during the Great Recession when the housing market was flooded with distressed sales, the Indicator maintained a steady upward drift from 2013 to 2020. But in the second half of 2020 when the ratio generally takes a seasonal dip, it jumped further to reach 100% by December 2020.
In other words, sellers who sold their homes generally obtained their full asking price, highlighting the competitive nature of the housing market over the last year. The high ratio also signifies that a higher share of homes are selling over the asking price compared to a year prior – in November, when the Buyer/Seller Market Indicator peaked, 36% of homes sold over the asking price, up from 19% in 2019.
Figure 1: Buyer/Seller Market Indicator Reached New Highs at the end of 2020
Competition among buyers intensified in nearly all metropolitan areas across the country at the end of 2020. Three exceptions were the San Francisco, California, Eugene, Oregon, and Reno, Nevada metros**[1]**. In San Francisco, where the index declined by 2 percent points in the fourth quarter compared to last year, buyers had been consistently paying at or over the asking price since 2013 when the local housing market initially intensified following the absorption of post Great Recession distressed inventory. Recent slowing of price competition is consistent with local demand moving away from the most expensive and relatively denser part of the Bay Area.
Vacation Towns Are on the Rise
On the other hand, the housing markets which saw the largest increase in Buyer/Seller Market Indicator between the fourth quarter of 2019 and 2020 are listed in Figure 2**[2]**. Interestingly, many of these metros are generally less densely populated metros adjacent to some of the largest metros, particularly in North East, but also vacations towns with either water or mountain access. One such example is Vineland-Bridgeton, NJ; it is located outside Philadelphia and on Delaware Bay, and market competition jumped from 94% to 99%. In addition, the CoreLogic Home Price Index clocked one of the largest jumps across all U.S. metros of 23% in December.
Figure 2: Top 20 markets with largest increase in Buyer/Seller Market Indicator
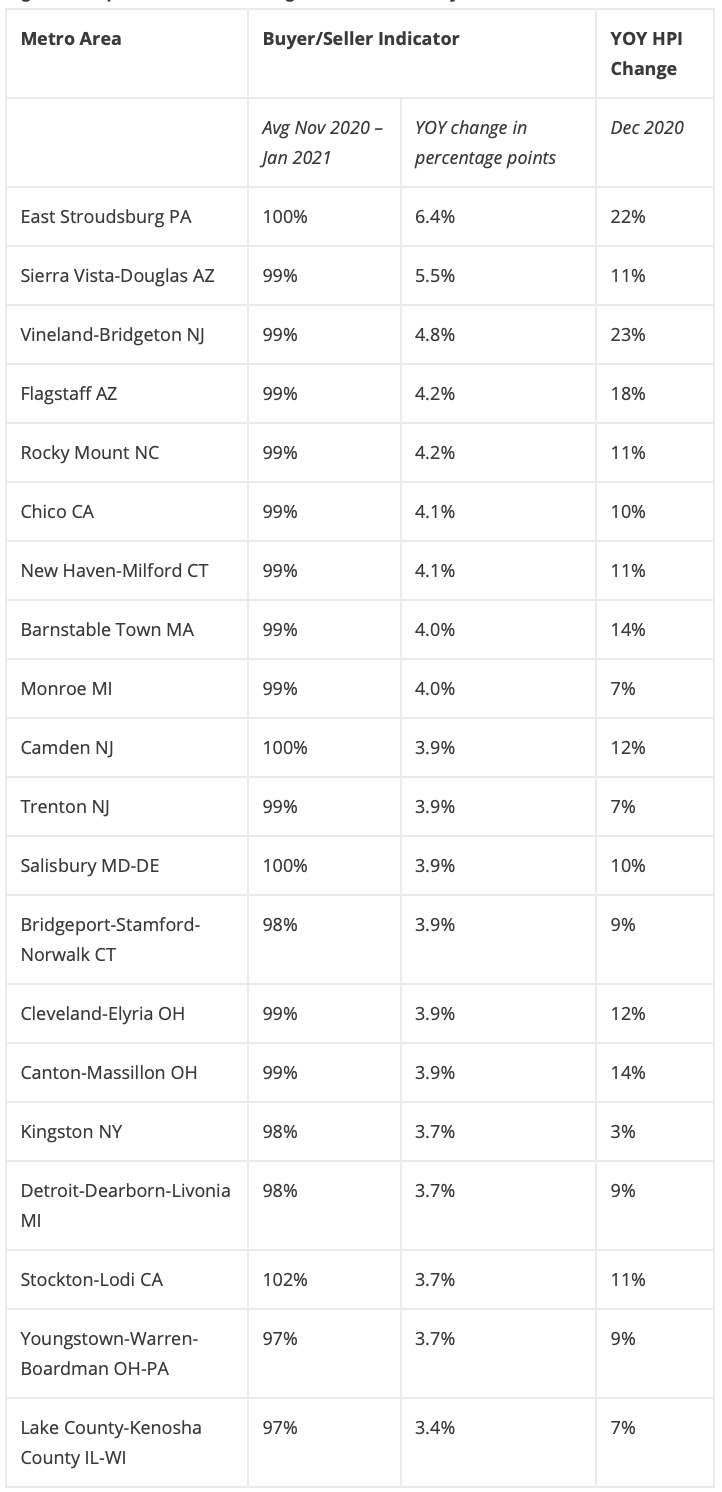
In addition, among the top 20 markets with the largest increase in Buyer/Seller Market Indicator are 5 markets located in Ohio and Michigan, including Cleveland and Detroit, where the increase in market competition may reflect relatively weaker competition prior to COVID-19 which may have intensified as housing markets across the country leaped into higher gear after the onset of the pandemic.
Going forward, buyer competition is expected to remain strong as we approach the traditional spring home buying season and the inventory of homes listed for sale remains at historic lows. Successful administration of mass vaccinations may help bring more inventory later in the year but with currently inventory-starved markets, the additional homes may not bring enough respite. The recent upswing in mortgage rates may push some potential home buyers out of the market, though with such low inventories of homes for sale the impact on the Buyer/Seller Market Indicator will likely be minimal.
[1] San Francisco metropolitan division includes San Francisco and San Mateo counties
[2] The analysis includes 233 metropolitan areas and metropolitan divisions
To learn more about the data behind this article and what CoreLogic has to offer, visit https://www.corelogic.com/.


Sign up to receive our stories in your inbox.
Data is changing the speed of business. Investors, Corporations, and Governments are buying new, differentiated data to gain visibility make better decisions. Don't fall behind. Let us help.


Sign up to receive our stories in your inbox.
Data is changing the speed of business. Investors, Corporations, and Governments are buying new, differentiated data to gain visibility make better decisions. Don't fall behind. Let us help.