
Introduction
Welcome to the April Apartment List National Rent Report. This month’s data shows rent prices continuing to rebound in markets across the country. Our national index increased by 1.1 percent over the past month, the largest monthly increase ever in our estimates, going back to the beginning of 2017.
The data continue to exhibit significant regional variation, but the days of plummeting rents in pricey coastal markets appear to be over. Although rents in San Francisco are still down 23.2 percent year-over-year, the city saw an increase of 3.4 percent this month, the biggest increase among the 100 largest cities in the country. 9 of the 10 cities with the sharpest year-over-year declines have now had two consecutive months of rising rents. At the other end of the spectrum, many of the mid-sized markets that have seen rents grow rapidly through the pandemic are showing that there’s still steam left in the current boom – Boise rents also jumped by 3.4 percent this month, and are now up by 16.1 percent year-over-year.
National index shows largest monthly jump going back to 2017
Our national rent index is up by 1.1 percent month-over-month, representing the second straight month of positive rent growth and the largest single month increase ever recorded in our estimates, which begin in January 2017. For comparison, in the previous three years, the average month-over-month rent growth in March was 0.6 percent. In other words, this month’s increase was nearly double the prior-year average for this time of year. This is the third straight month that rent growth has outpaced the average of recent years. This month’s increase wipes out the COVID dip in our national index – year-over-year rent growth is now flat nationally, compared to the 0.8 percent year-over-year decline that we reported last month.
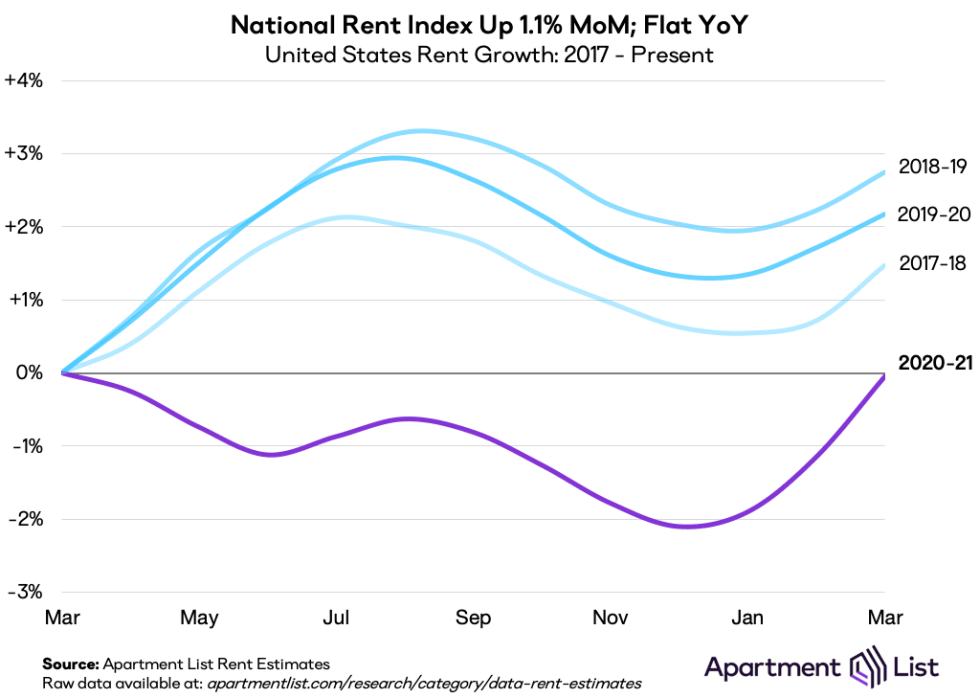
The growth in our national index is quickly reversing the disruption experienced in the early stages of the pandemic. Rents fell by 1.2 percent nationally from March through June of 2020, but in the second half of 2020, national rent growth was largely in line with the seasonal trend that we’ve observed in prior years. More recently, our national rent index has started growing faster than the typical seasonal trend. This reflects that fact that in markets like San Francisco where rents had been falling fastest, prices have turned a corner and are now rebounding. At the same time, booming markets such as Boise are still continuing to see prices climb. More broadly, as vaccine distribution continues to gain momentum, we may be starting to experience the release of pent up demand from renters who had been delaying moves due to the pandemic.
Rents in coastal superstar cities continuing to rebound
San Francisco consistently made headlines throughout the pandemic for the staggering rent declines that have led the nation, but this month, the city ranks #1 for the fastest increase in prices, with rents up 3.4 percent over the past month. Although rents in San Francisco are still down by 23.2 percent year-over-year, they have now increased by a total of 4.8 percent over the past two months. For comparison, San Francisco rents fell by an average of 3.4 percent each month from April through December 2020.
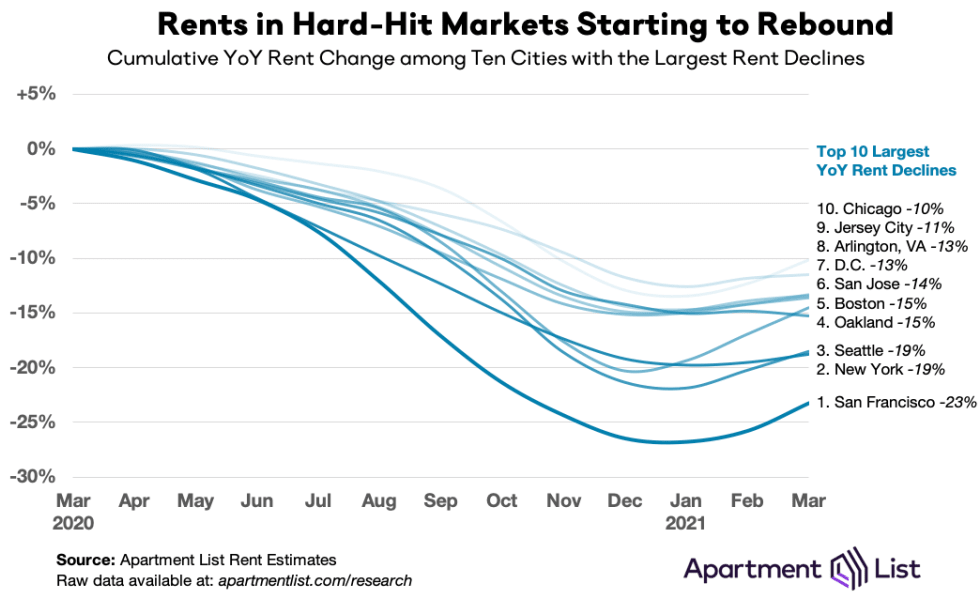
Beyond San Francisco, we’re seeing a similar trend playout in nearly all of the cities where rents have been falling fastest. Nine of the ten cities with the sharpest year-over-year rent declines have now experienced positive rent growth for the past two months. Three of these cities – Boston, San Jose, and Washington, D.C. – have seen rents increasing for three consecutive months. The following chart shows month-over-month rent growth from 2018 to present for six of the cities that have been hit hardest by the pandemic:
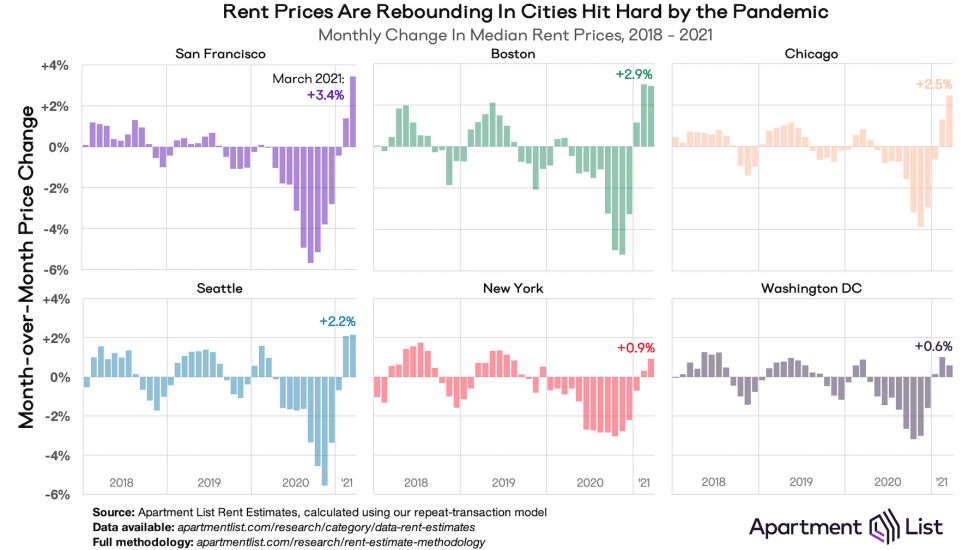
In each of the panels in the chart above, we see three distinct phases:
In four of the six cities shown, the fastest single month rent increase since 2018 occurred this month or last month. Rents in Boston have increased by 7.3 percent over the past three months, erasing more than one-quarter of the city’s pandemic rent decline. In each of these cities, rents are still well below pre-COVID levels, and it remains to be seen if these large monthly increases will continue. But as of now, the rent rebound in pricey coastal superstar cities is happening sooner and more rapidly than we expected.
Affordable mid-size markets continue to boom
As expensive coastal cities watched rents plummet throughout 2020, a separate group of mid-sized markets were heating up. The pandemic and remote work spurred demand for the space and affordability that these cities offered, and in response, rent prices grew even as the surrounding economy struggled. But while rent declines in expensive markets have reversed course, the cities where rents have been growing fastest are continuing to boom.
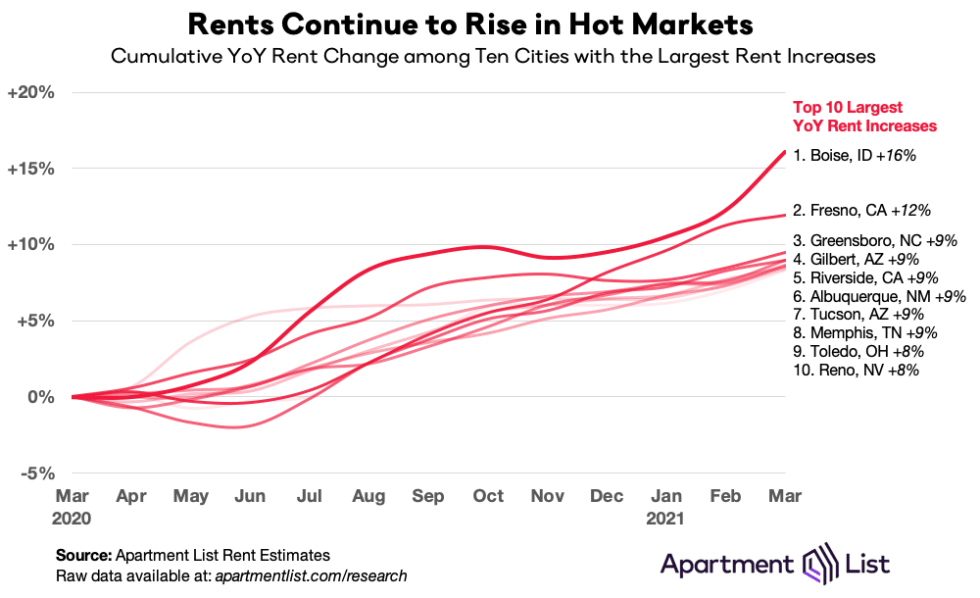
Leading the trend is Boise, ID, where rents grew another 3.4 percent over the past month – tying San Francisco for the nation’s fastest month-over-month growth. Boise also continues to rank #1 for fastest year-over-year growth, which now stands at 16.1 percent. All of the 10 cities with the fastest year-over-year rent growth saw prices continue to increase this month.
It’s worth noting that many of these markets had been heating up prior to the pandemic. For example, from January 2017 to January 2020, rents in Fresno increased by 22.6 percent, the nation’s third fastest growth over that period. Tucson ranked #5 for fastest rent growth from 2017 to 2020, and seven of the ten cities with the biggest pandemic booms were in the top 20 for pre-pandemic growth. The pandemic did not necessarily start a new trend in these markets, so much as accelerate an existing one. This stands in contrast to what has happened in the expensive markets discussed above, for which the rent declines of the past year were a complete aberration. Given this longer-term context, as well as the continued upward trajectory in rent trends, it seems that Boise and cities like it have yet to hit their peaks.
COVID shakeups have led to some convergence of expensive and affordable markets
As described above, affordability has been a key determinant of whether cities are experiencing falling or rising rents during the pandemic. The relationship is made more explicit in the chart below, which plots rent levels against rent changes for the 50 largest cities in our data. There is a clear correlation between the two; the cities that had the highest rents in March (moving right along the x-axis) have seen the steepest rent drops since then (moving down along the y-axis).
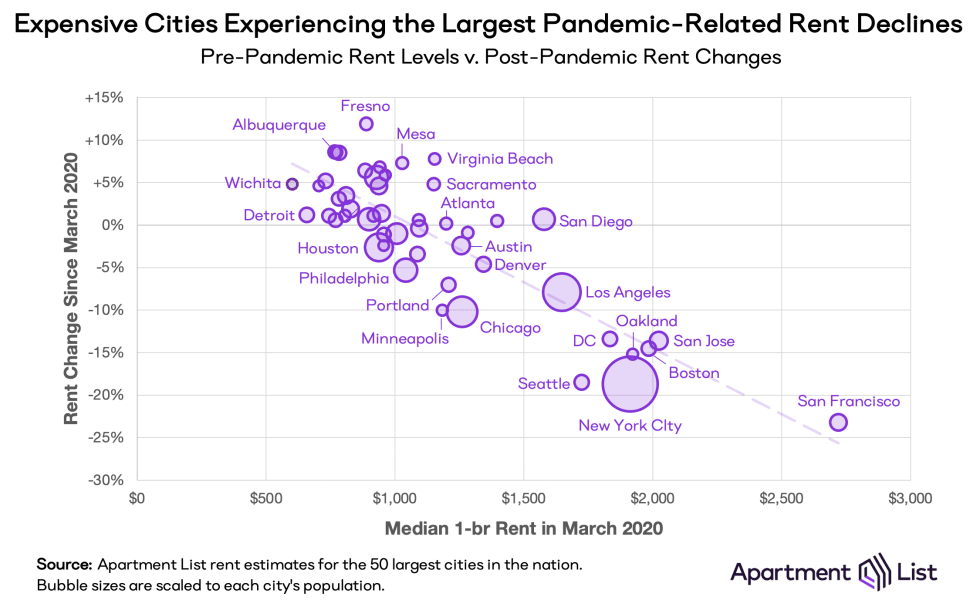
Meanwhile, the cities that had the most affordable rents at the onset of the pandemic are most likely to have seen prices climb. This has led to a certain degree of convergence in rent prices across these cities – the most expensive markets have gotten somewhat more affordable, while the most affordable markets have grown pricier. For example, last March, the median 2-bedroom rent in San Francisco was $3,146, which was 3.4x the $929 median for a 2-bedroom in Boise. As of this month, the 2-bedroom median in San Francisco has dropped to $2,410, while in Boise it has grown to $1,078, meaning that rents in San Francisco are now just 2.2x those in Boise. While still a significant price difference, the affordability gap has narrowed substantially.
Conclusion
Since the start of the COVID-19 pandemic, we have witnessed significant disruptions to rental markets across the country. Social distancing and remote work changed what people want in a home, while many renters were thrust into immediate and unexpected financial hardship as layoffs and furloughs rippled through the economy. These sudden changes to budgets and preferences led to a convergence in rental prices across the U.S. – the most expensive markets saw rents fall rapidly while a number of more affordable mid-sized cities experienced accelerating rent growth. This month’s data indicates that the markets where rents have been falling sharply have turned a corner, and in some cases, prices in these cities have started to rebound rapidly. But although some may be moving back to superstar cities, affordable mid-sized markets are continuing to boom. As vaccine distribution continues to gain momentum, rental markets may be beginning to reflect the preferences of a post-COVID future.
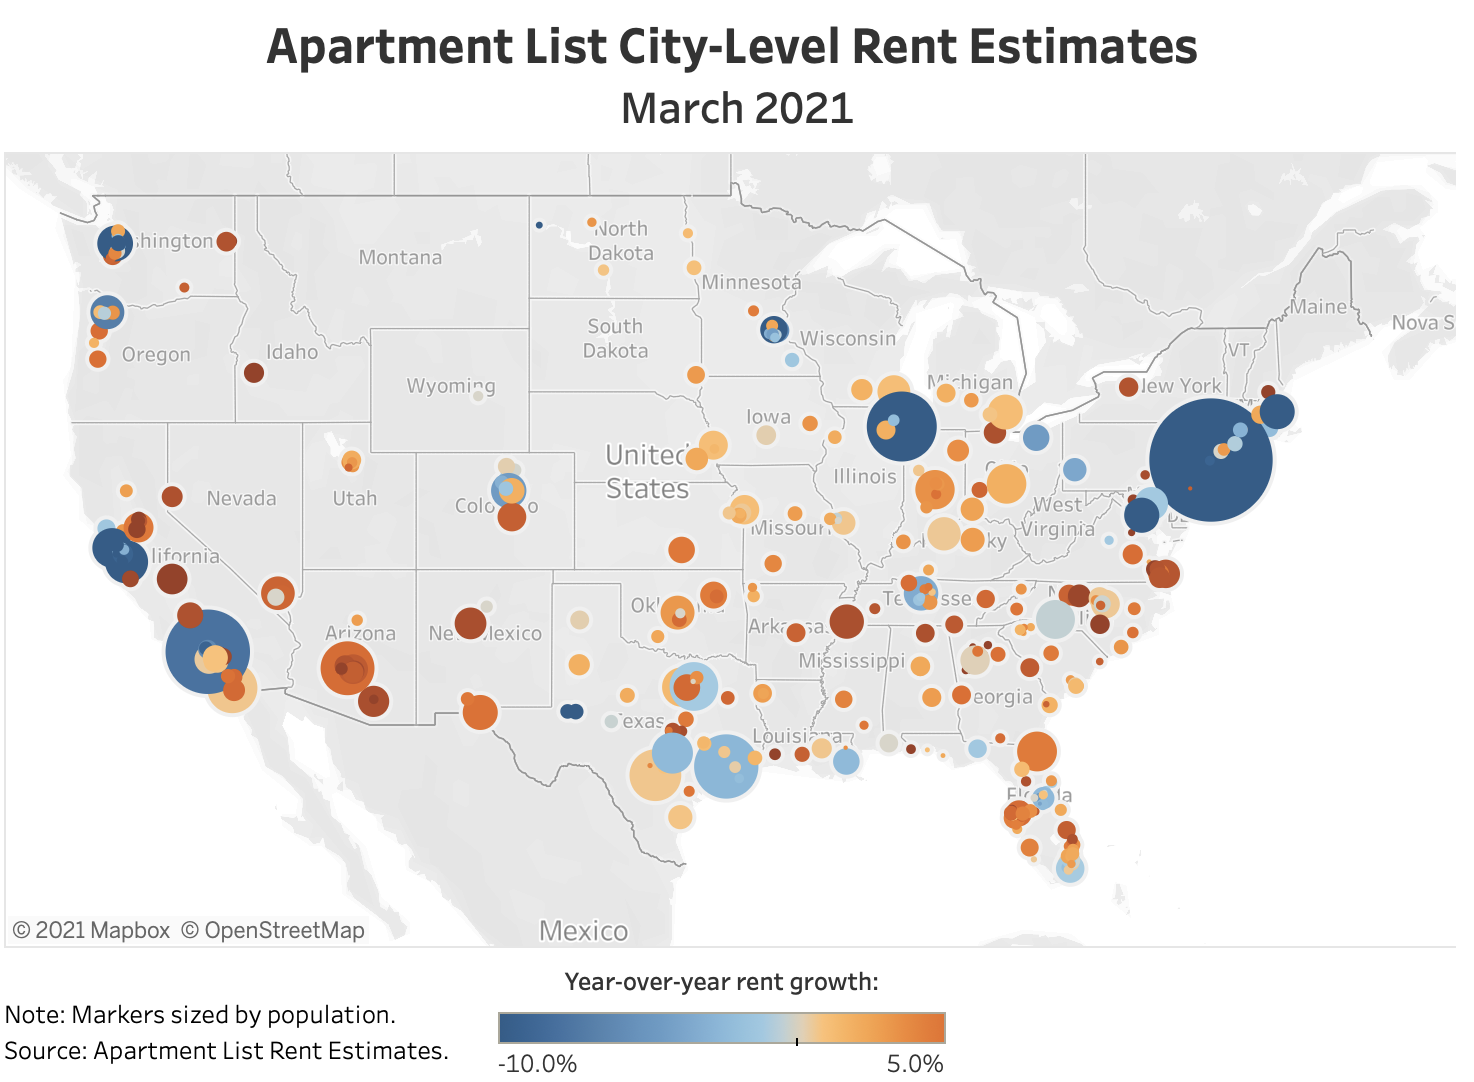
For complete data, explore the interactive map below or head over to our rental data page, where you can download the most recent estimates for your city, as well as historic data going back to 2017. And as always, feel free to contact us with any questions!
A Note on Our New Rent Estimate Methodology
Apartment List has long been committed to making our rent estimates as accurate and transparent as possible. With this in mind, we recently introduced a new methodology that rethinks our approach while building upon the robust foundation that was already in place. The most significant change in our new methodology is that we are now aiming to identify transacted rent prices, as opposed to the listed rent prices on which our old methodology was based. This controls for price fluctuations that arise over the course of a vacancy. Using these transacted prices, we calculate rent growth rates based on a same-unit approach that controls for compositional changes in the rental stock. As before, we continue to combat luxury bias in our rent data by using fully-representative median rent statistics from the Census Bureau’s American Community Survey.
To learn more about the data behind this article and what Apartment List has to offer, visit https://www.apartmentlist.com/.


Sign up to receive our stories in your inbox.
Data is changing the speed of business. Investors, Corporations, and Governments are buying new, differentiated data to gain visibility make better decisions. Don't fall behind. Let us help.


Sign up to receive our stories in your inbox.
Data is changing the speed of business. Investors, Corporations, and Governments are buying new, differentiated data to gain visibility make better decisions. Don't fall behind. Let us help.